
SUBSCRIBE
This week I was reminded of the old Wall Street rule of thumb called “Three steps and a stumble”, which means that the stock market tends to decline if the Fed Funds rate moves upwards three consecutive times. It has relevance to the real estate market also, obviously. Having been through three massive 75 basis point increases in the Fed Funds rate (and the fifth consecutive increase in a row), there seems to be some decision paralysis in the market. The Insider is here to help you with a decision framework.
Let’s look at local market data and see what’s what.
Let’s start with new development supply, something the Insider mentioned in passing recently. Current units on the market = 862.
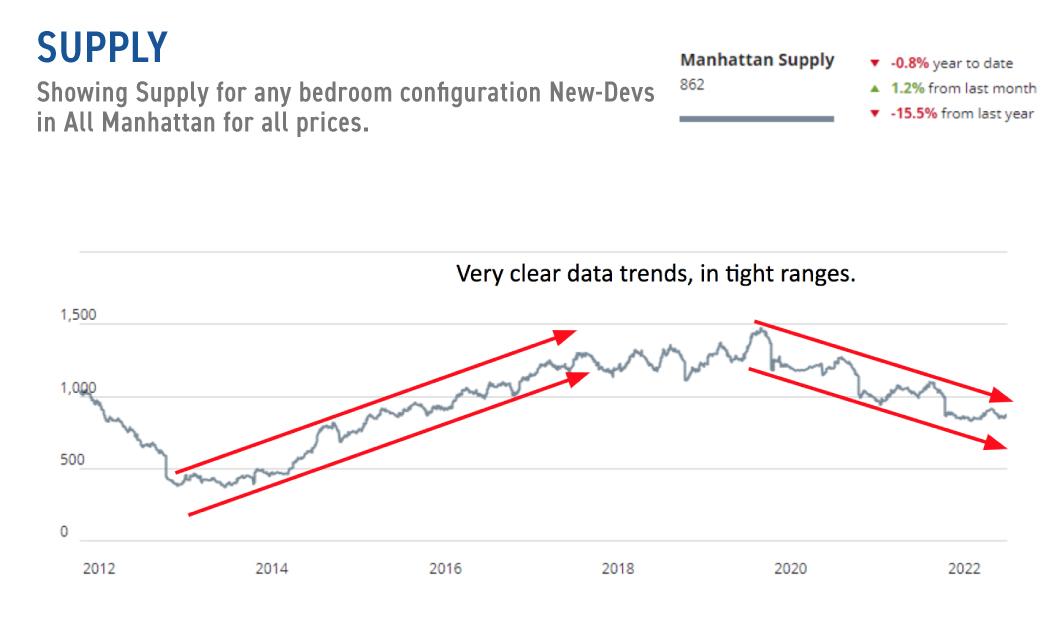
Source: Urbandigs
As you can see, the supply story is super clear here. It increased in a very strong trend from late 2012 to 2017. Since 2020, it has been doing the opposite. Notably the trend is still super clear. Supply is dropping and since the cycle from concept to sales in new dev is about a half-decade, it’s likely to persist in its current trend for a while. During this period expect developers to hew to their asking prices and be stingy with concessions (such as paying the transfer tax).
In the much broader resale market (current units = 6,337), the trend is far from clear.
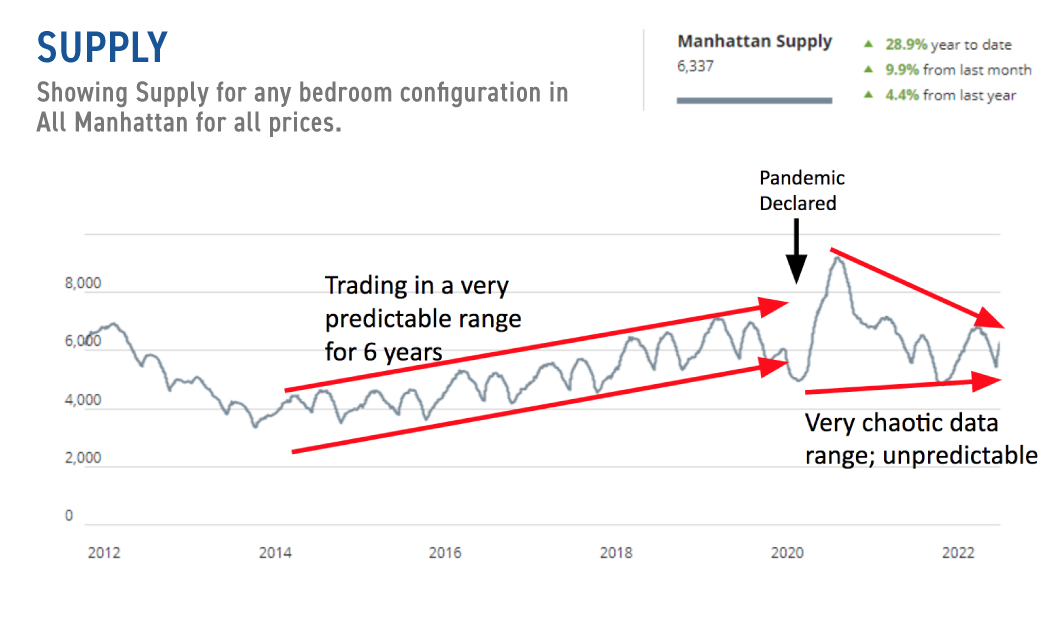
Source: Urbandigs
As you can see from the chart above, there was a very clear data trend from 2014 until 2020. That was upended with the pandemic, and since then the “trend” has been clear as mud. You can see in the data the chaos that the pandemic has made of, well, nearly everything.
What we can tell from the chart is that in spite of the fear in the market at the moment (I’m speaking anecdotally), the market is in fine shape, at current supply levels of the 2017-2019 period, and nowhere near the highs of 2020 or the 2009-2010 period (not on the chart but much higher).
Demand
In real estate, supply is a direct calculation and is simply the number of apartments on the market. Demand can only be measured indirectly, and the best that we have is contract activity. We don’t really know the number of people actively looking at real estate for purchase, and there’s no way to find out that number. But we can see how many buyers actually did buy something because every signed contract meant a buyer did something. Let’s take a look:
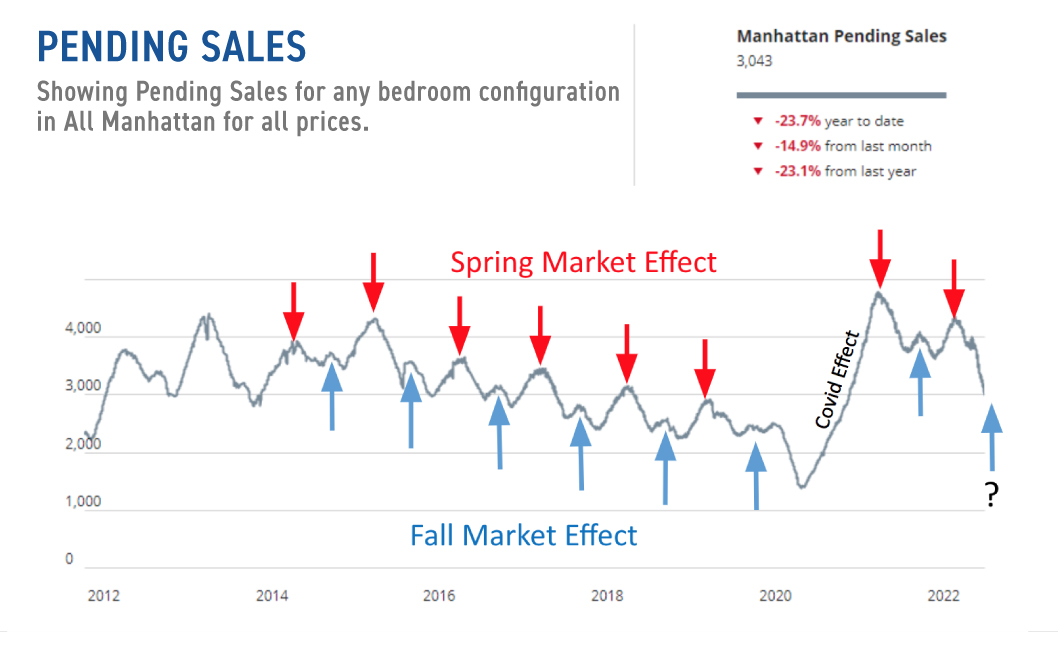
Source: Urbandigs
To begin with, notice that the data clearly shows the fall and spring seasonality of our market. It also shows how much more powerful the spring market is than the fall market. But both exhibit distinct waves of buying activity. If you were wondering if there are more buyers in spring or fall, you need to never wonder again.
More importantly, for the topic of today’s discussion, two things of note:
- Demand (as measured by signed contracts) is still higher than it was from summer of 2018 to fall of 2020
- Although the trend is currently falling, expect an upward bump anyway shortly due to the seasonal fall market effect.
A Combined Picture
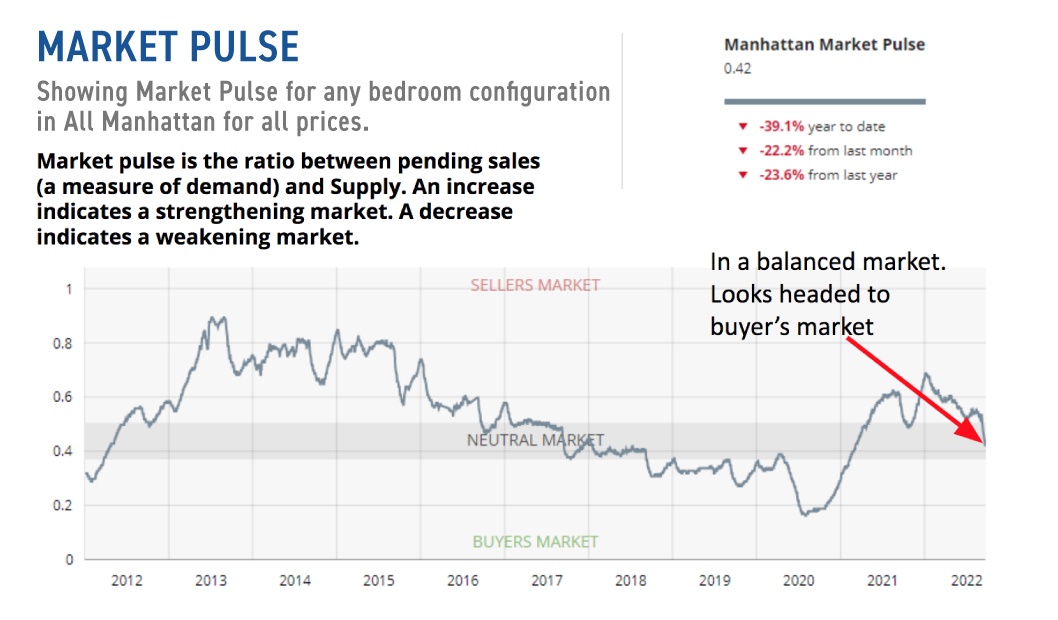
Source: Urbandigs
This chart shows the ratio of in contract properties to listed properties. Higher numbers indicate a seller’s market, and the opposite is true for a buyer’s market. Intuitively this makes sense. If there are 100 apartments listed and 100 in contract sellers are in the driver’s seat (market pulse = 1.0). If there are 100 apartments on the market and only one in contract, buyers are in control (market pulse = 0.01).
The Market Pulse chart combines supply and demand into one view, and gives a better sense of what’s happening overall.
Here are our takeaways from this chart:
- We are currently in a balanced or neutral situation, after having spent the last two years in a seller’s market.
- The trend is definitely towards buyer’s market territory, but we’re not there yet.

—Washington Post
Here are the two relevant charts graphics. The first one shows where the housing markets are cooling (purple) and where they are stable (green). The second one zooms in on the greater NYC Metro Area.
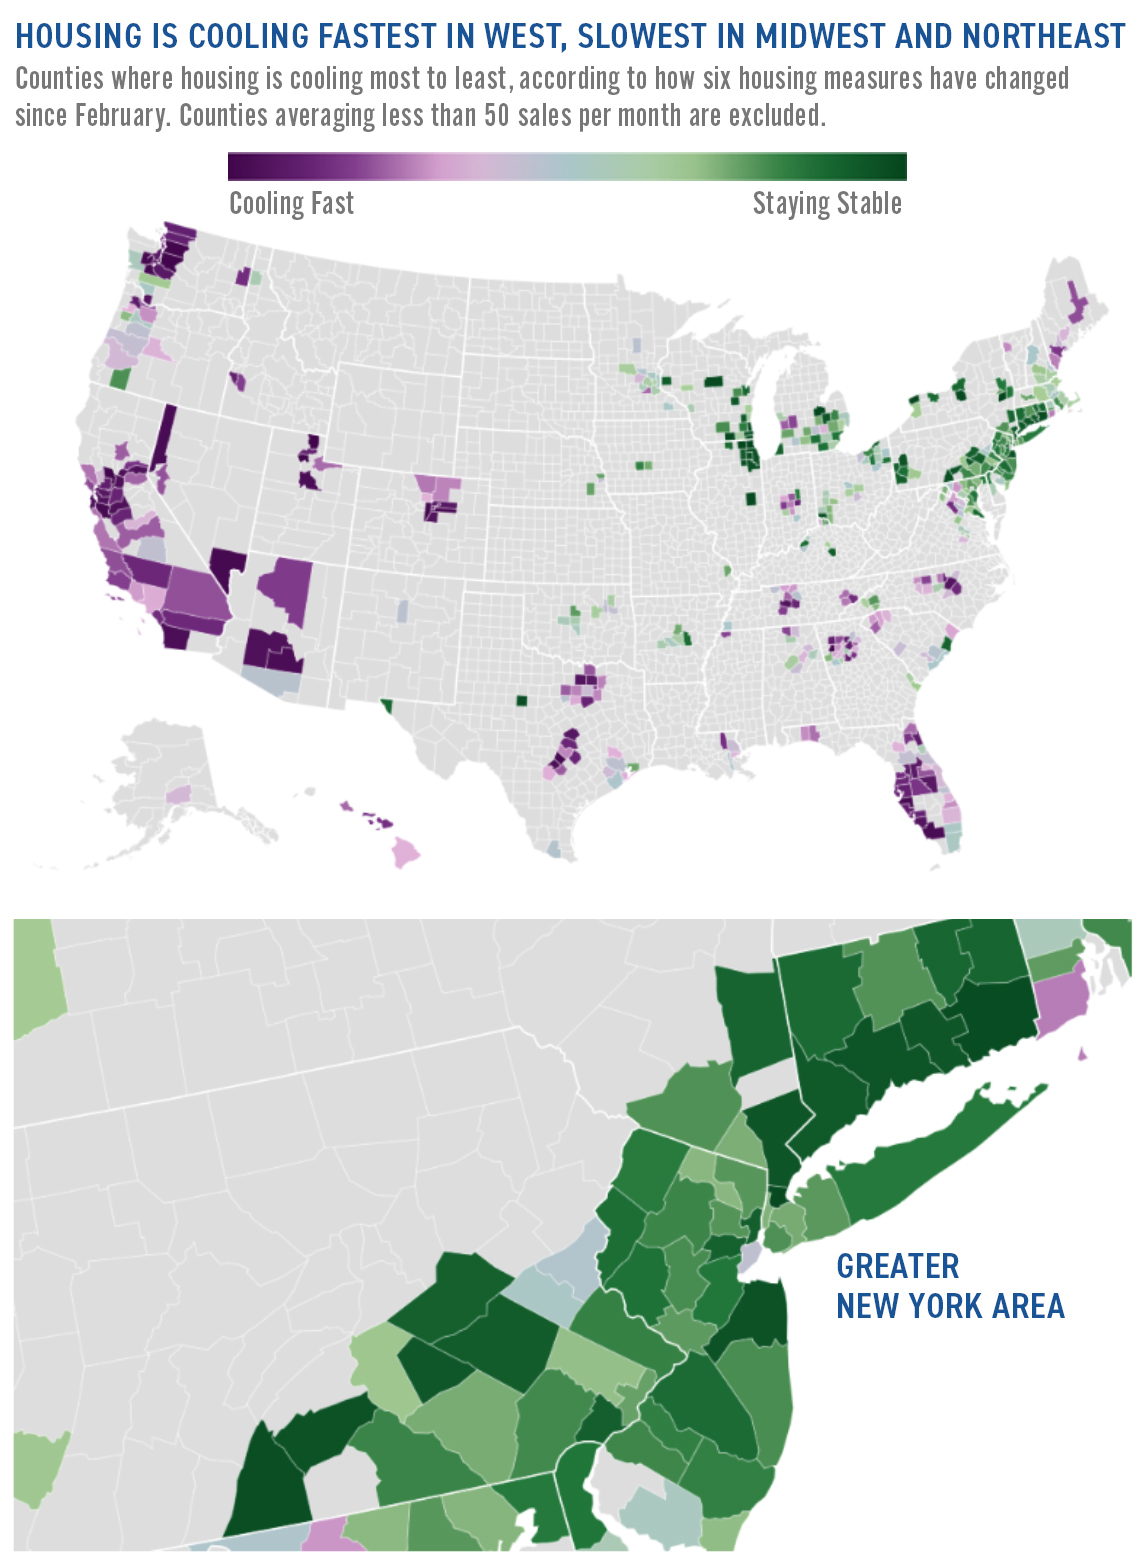
Our region (including Manhattan) is exhibiting strong stability compared to other areas in the country. This does not mean that the zones in green are appreciating markets! Just that they are not dropping.
Just Tell Me What To Do
The hyper-local data points to a cooling market here in Manhattan but the effect is not particularly dramatic. Supply is similar to where it was in 2028-2019 which when we were living through it felt fine.
Demand is cooling from very high levels, but is still higher than most of 2018-2020.
With the third 75 basis point increase in the Fed Funds rate, there will be a cooling effect, which cannot be denied.
If You Are A Seller, Consider This
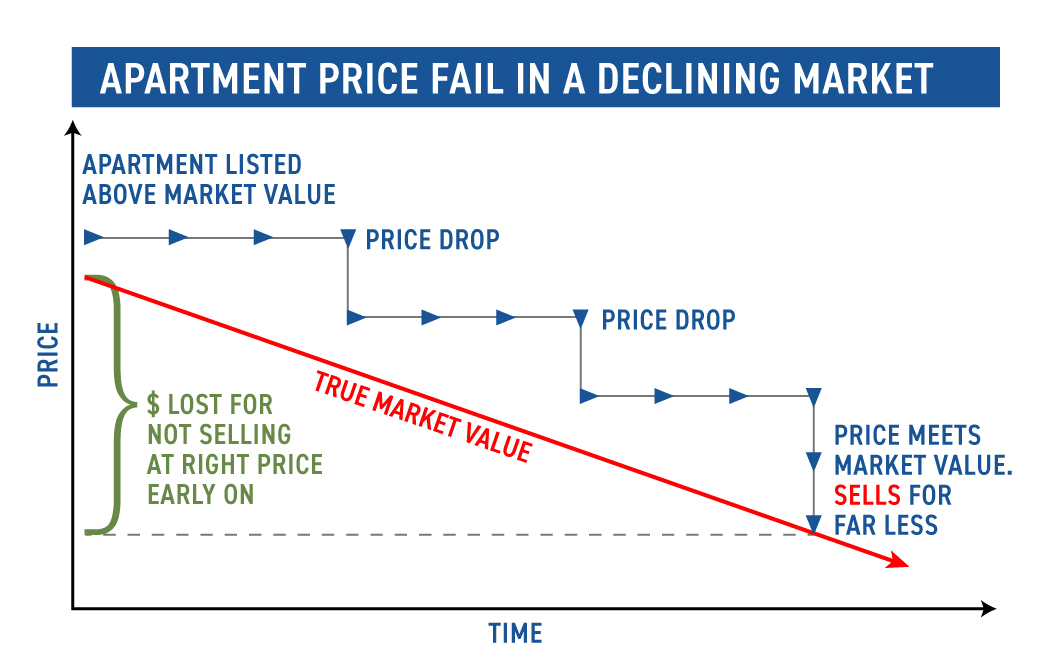
This graphic shows what happens to sellers that don’t adjust to market realities fast enough in a falling market. In the case above, seller’s initial price is just above the market price. Time goes on and the market drops. Seller finally does a price adjustment. Unfortunately this price drop does not take into consideration the reality of where the market is. So the apartment sits on the market. They finally do another price adjustment, but make the same mistake. It’s only on the third price drop that they get serious and drop the price enough to meet the actual market price. At this point they finally sell. As you can see they lose quite lot of money by not recognizing the market realities early.
If this looks overly theoretical, believe me: I’ve seen this exact scenario play out hundreds of times first hand. So if you believe the market is going to go through a prolonged decline the message is: sell now and price aggressively. Being passive and waiting will only hurt you.
If You Are A Buyer, Consider This
We are in a balanced market for the first time in two years. It would be tempting to just sit and wait but here are the conditions under which you should buy now:
- You have a compelling life reason to do so
- You can afford it
- You find a well priced apartment or motivated seller
- You plan to own your apartment for more than 5 years
- You stick to your guns on negotiating
- You are financing (as rates look like they’re going higher before they go lower)
Timing the top or bottom of the market is almost impossible. Finding a wide window of time and conditions in which a transaction makes sense is much easier. Just make sure it makes sense and you’ll almost certainly be doing the right thing.
I hope this helps you think through your current situation. As always if you want more perspective or help with a transaction, contact us.
Have a great weekend everyone!
SUBSCRIBE
Watch the live recap of today’s Insider with Mark Chin and Josh Rubin here: