Category

The Insider

Top 5 Predictions for 2023

By | The Insider | No Comments

SUBSCRIBE TO THE INSIDER


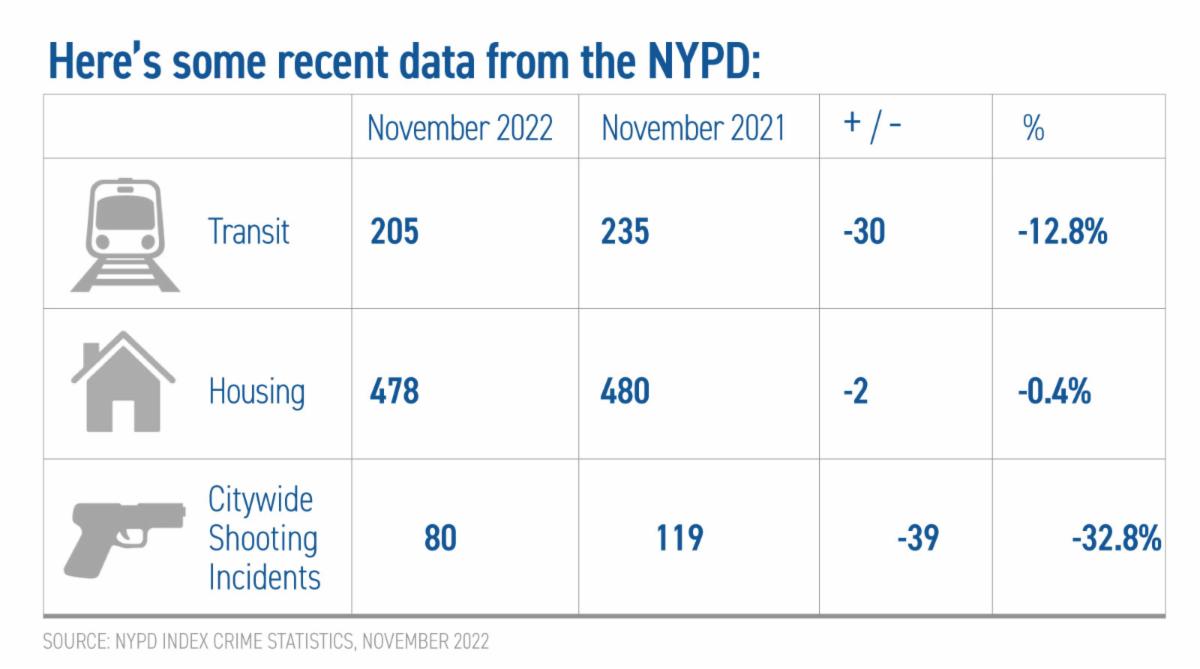
1: New York’s Crime Wave Will Recede, Spurring Confidence in NYC as Investment-Worthy

Hochul had a scary moment before getting reelected as Lee Zeldin came too close to comfort in his polling and results on an anti-crime platform. Our Governor and Mayor heard that message loud and clear. Notwithstanding the drum beat of gruesome crime reporting out of the NYC press, the subways are already much safer than they were this summer. The NYPD surge underground has already been having a salutary effect and the feeling is less, well, scary and hostile. Mayor Adams’s plan to remove severely mentally ill people from the streets (and particularly the subways) will inevitably bring down the random violence that has been so unsettling. This will give both foreign buyers and locals the confidence to invest capital here.
—NY Times

2. Mortgage Rates Will Have Peaked in 2022 and Will Recede in 2023

I am totally unsure why I seem to be the only person saying this, but the peak in the 30 mortgage rate already happened in late October/ early November when the rate briefly crossed 7% for conforming mortgages.  The Fed’s actions in both the short and long end of the yield curve are having their effects and inflation is cooling. The yield curve inversion means longer term rates are lower than short term rates, and this tends to precede a softening economy. So the Fed will loosen up on the short end of the curve and there you go. How obvious is this?? And yet people are still grousing about rates. That story is behind us and 2023 will see mortgage rates drop further.

3. There Will Be a New Law Authorizing a 421A-like Tax Break for Developers

Liberal lawmakers kiboshed the 421G tax abatement program proposal that Hochul made in early 2022 on the basis that it was too much of a giveaway to big developers at the expense of taxpayers. Well you know what’s a much bigger burden on taxpayers? RENT.

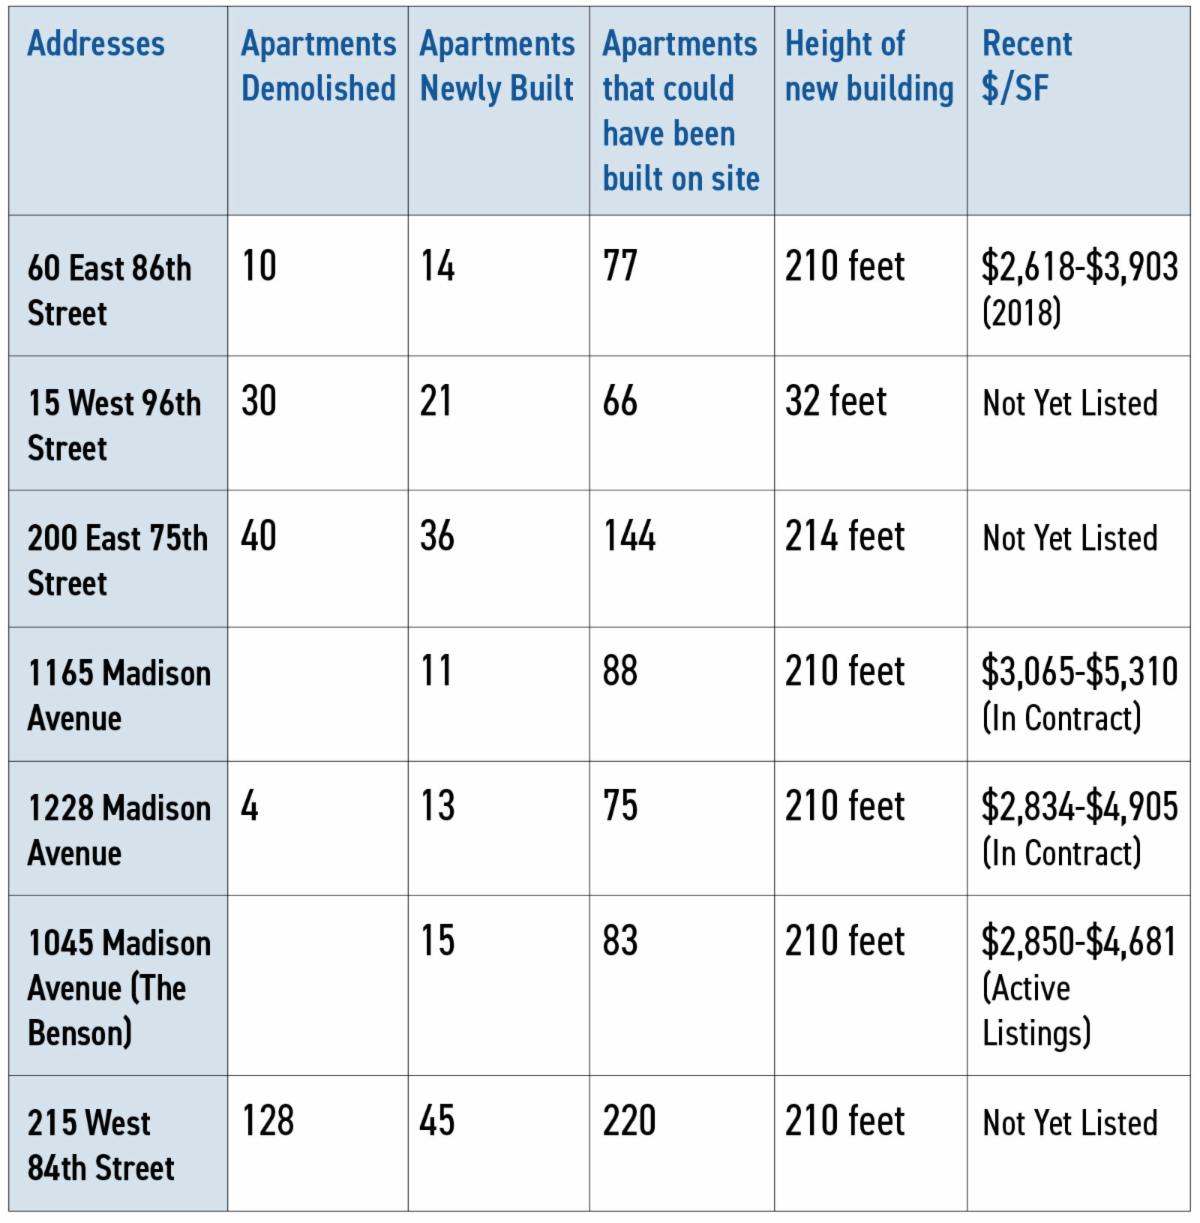
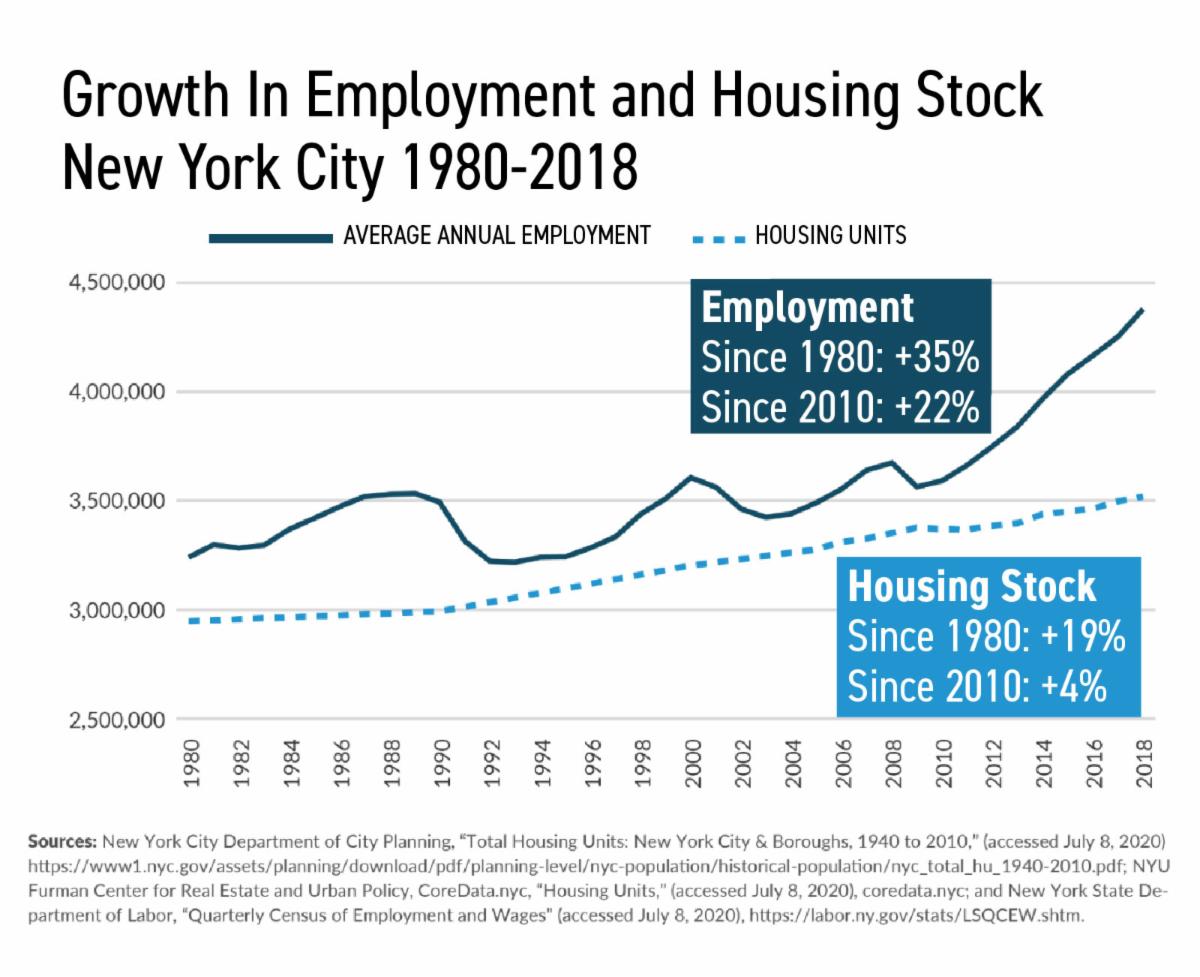
This means the sheer pressure on lawmakers to create more housing will become intolerable. That being said, higher interest rates and the lack of the 421A tax abatement program make most development uneconomic for developers. So there will be a new tax abatement program to spur new housing development in 2023.


4. Commercial to Residential Conversions Will Begin In Earnest

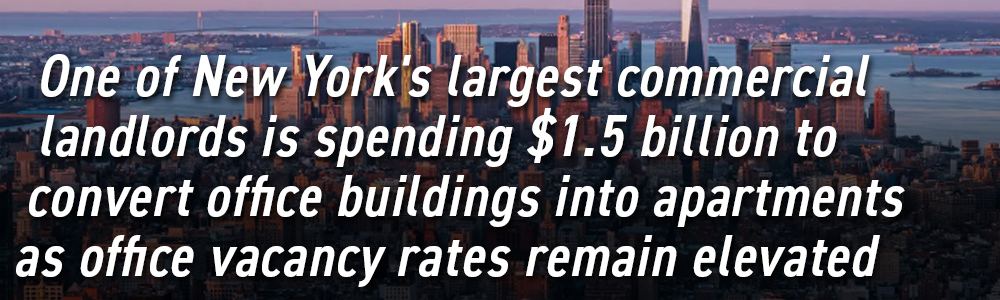
As we wrote in The Insider last week, the work from home movement has hollowed out many office buildings, particularly those that are older and rather tired. With demand for office space at an all time low and demand for housing at a fever pitch, we will start to see conversions of office space to residential apartments in 2023. In fact Silverstein Properties has already raised a $1.5 billion dollar war chest for this effort (and is in the midst of converting another building at 15 Broad already).

—businessinsider.com


Expect this office to residential trend to gain major steam in 2023, revitalizing tired commercial areas for the next several years.


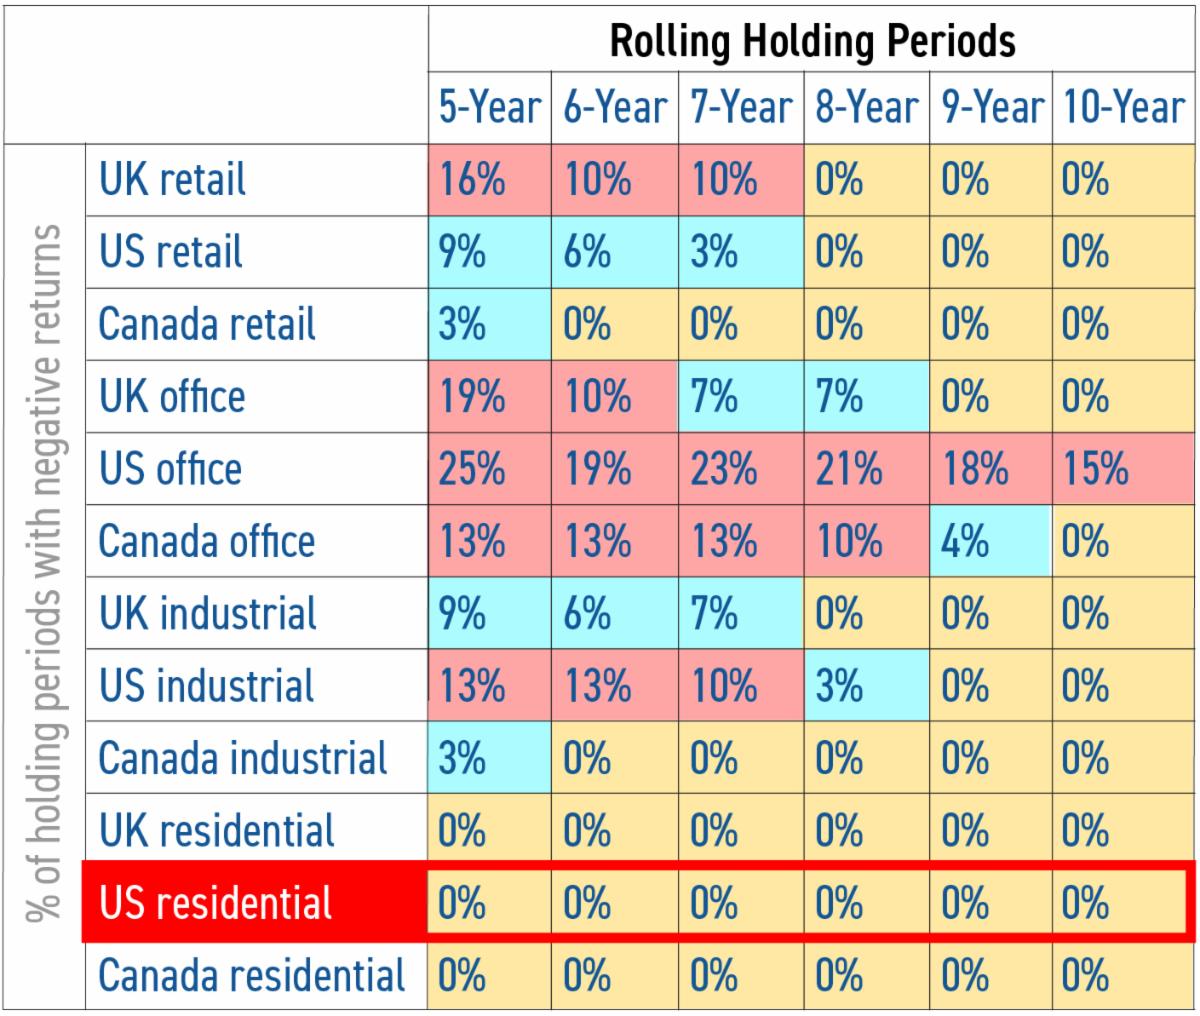
5. There Will Be Major Institutional Interest In Multi Family Properties During a Year-long Flight to Quality

Even before Work From Home and the pandemic, the multifamily asset class was considered a more blue chip asset than office space. Why? Commercial is more volatile. Think about it this way. If you have a class B or C office building that is getting long in the tooth, your anchor tenant could move to, say, Hudson Yards and leave you with a 40% vacancy rate. A few more tenants leave and you have big problems. But in residential, in a town where the vacancy rate is typically in the low single digits, 40% of your tenants just don’t walk out of the door at the same time. That is not a thing. Blue chip means predictable, long term income, which is exactly what you get from residential multifamily properties.

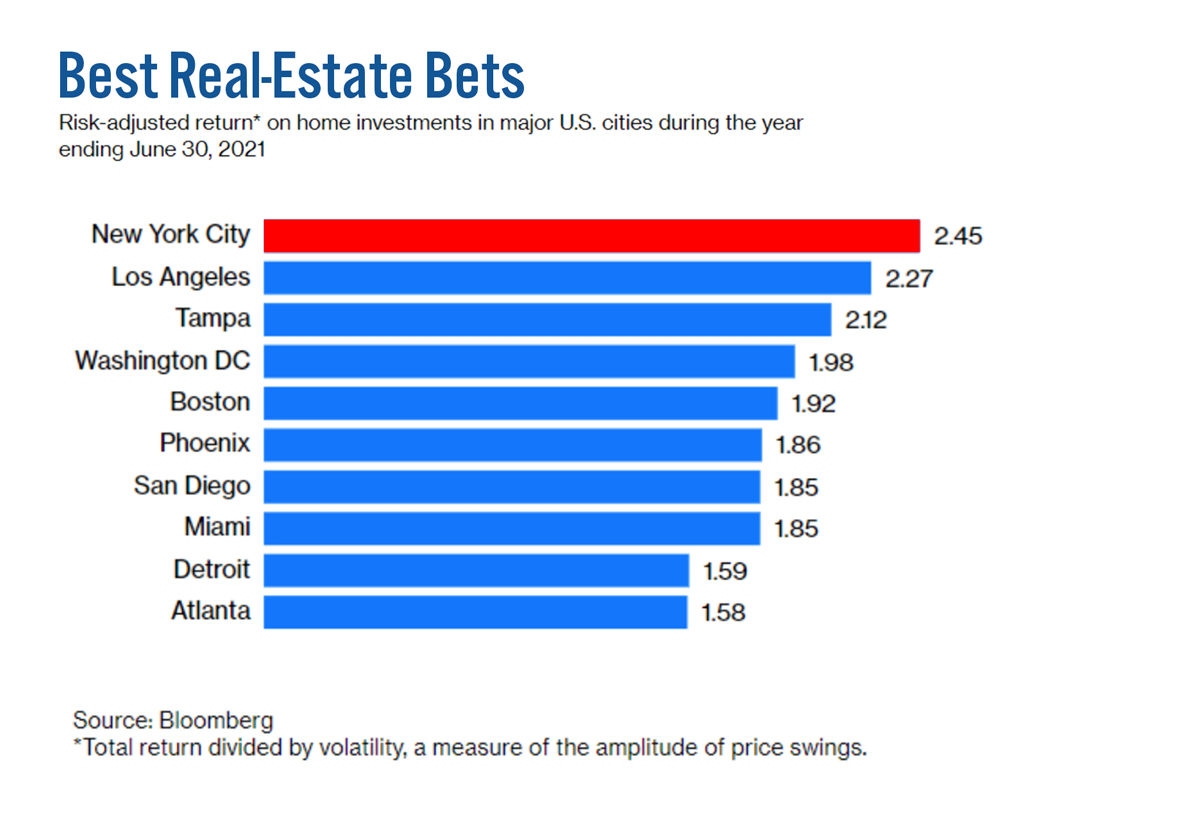
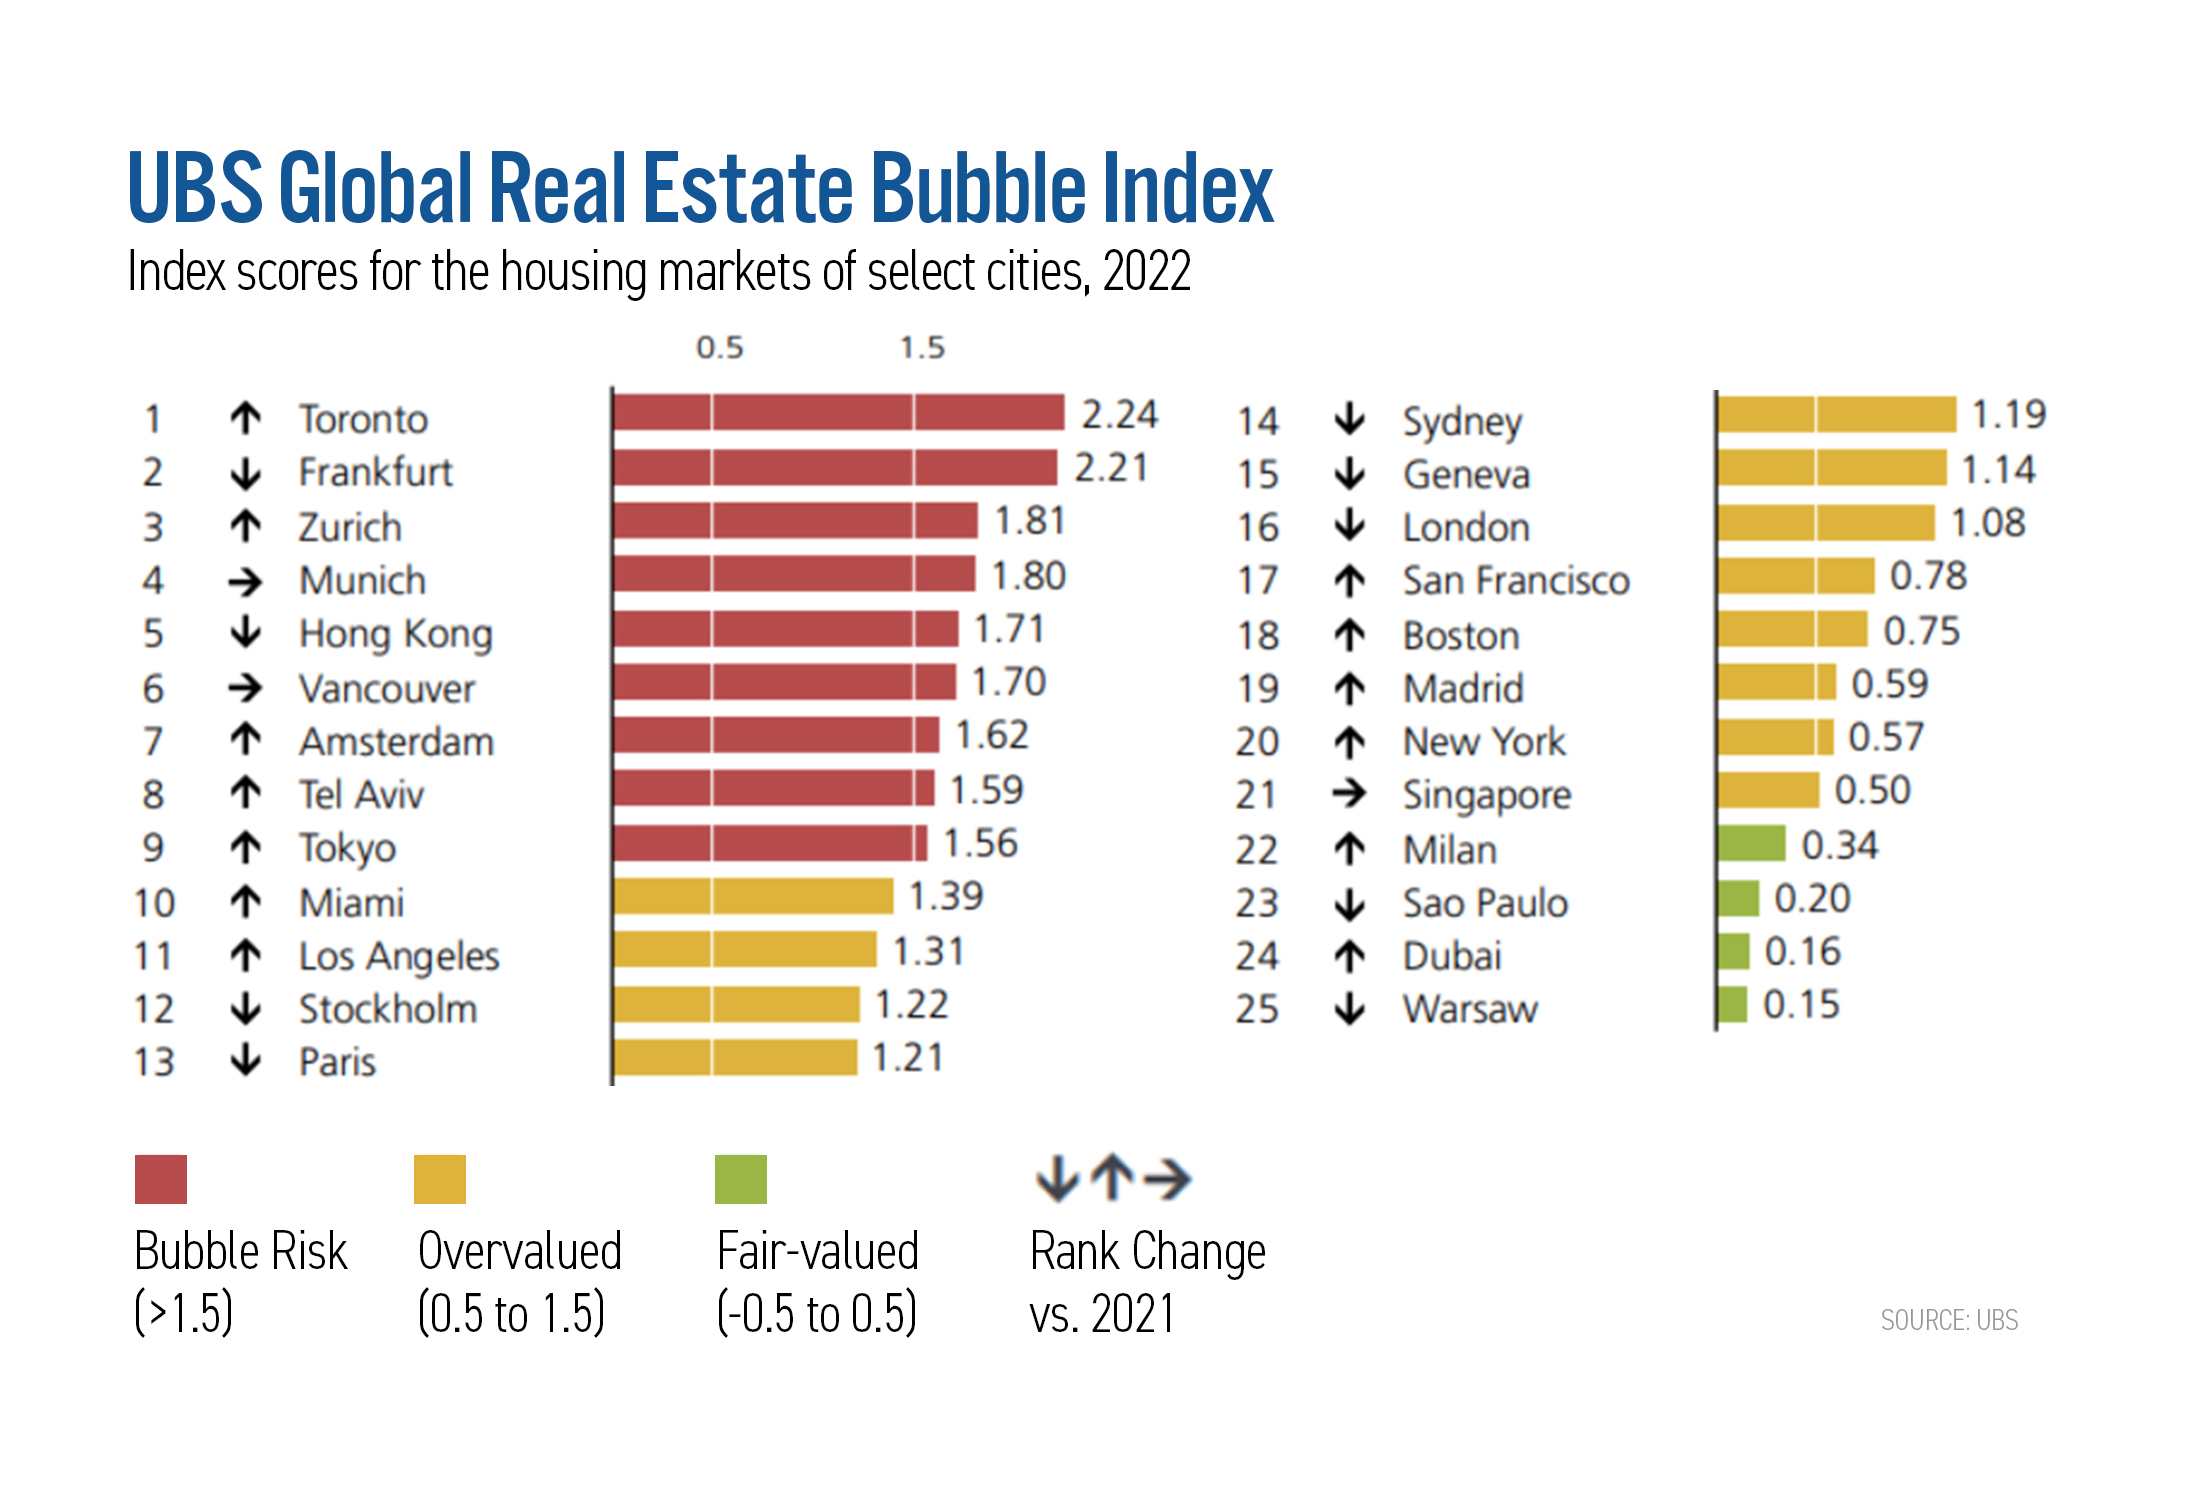
These things are going to push global assets to the bluest chip of all real estate investments (NYC multifamily properties):

  • NYC’s distance from Europe’s theater of conflict with Russia
  • Equity volatility globally
  • China’s Covid mess (not to mention their own property mess)
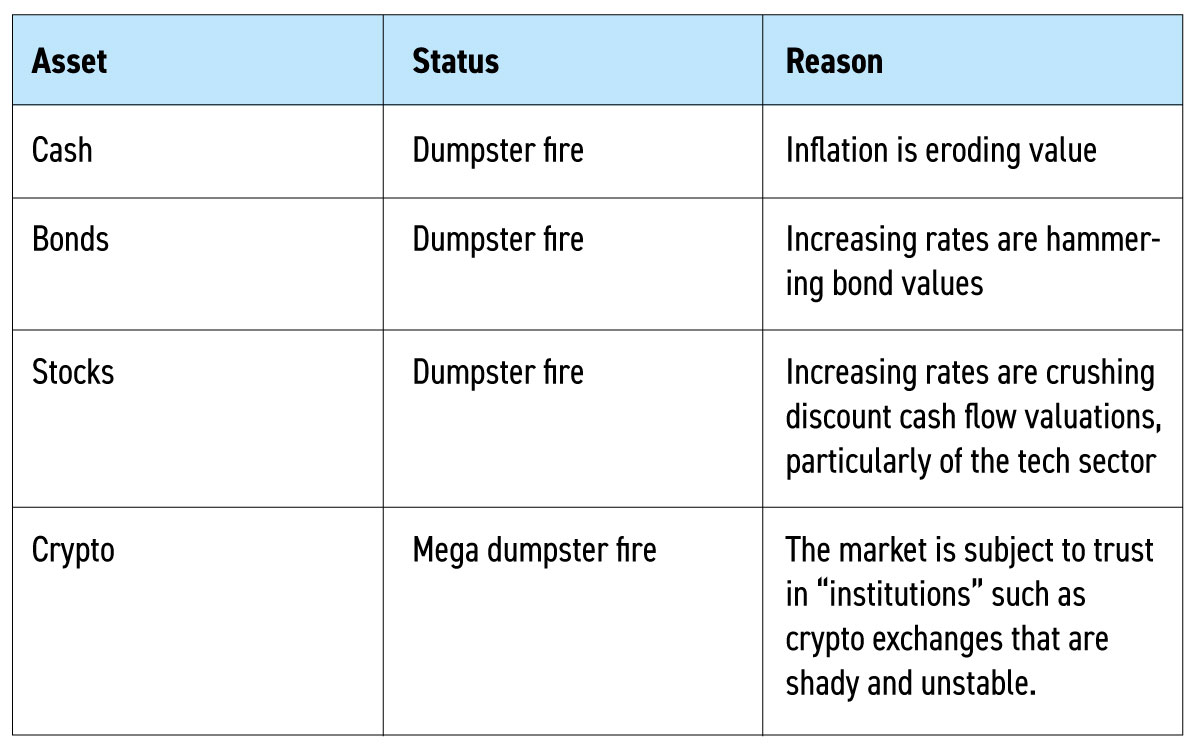
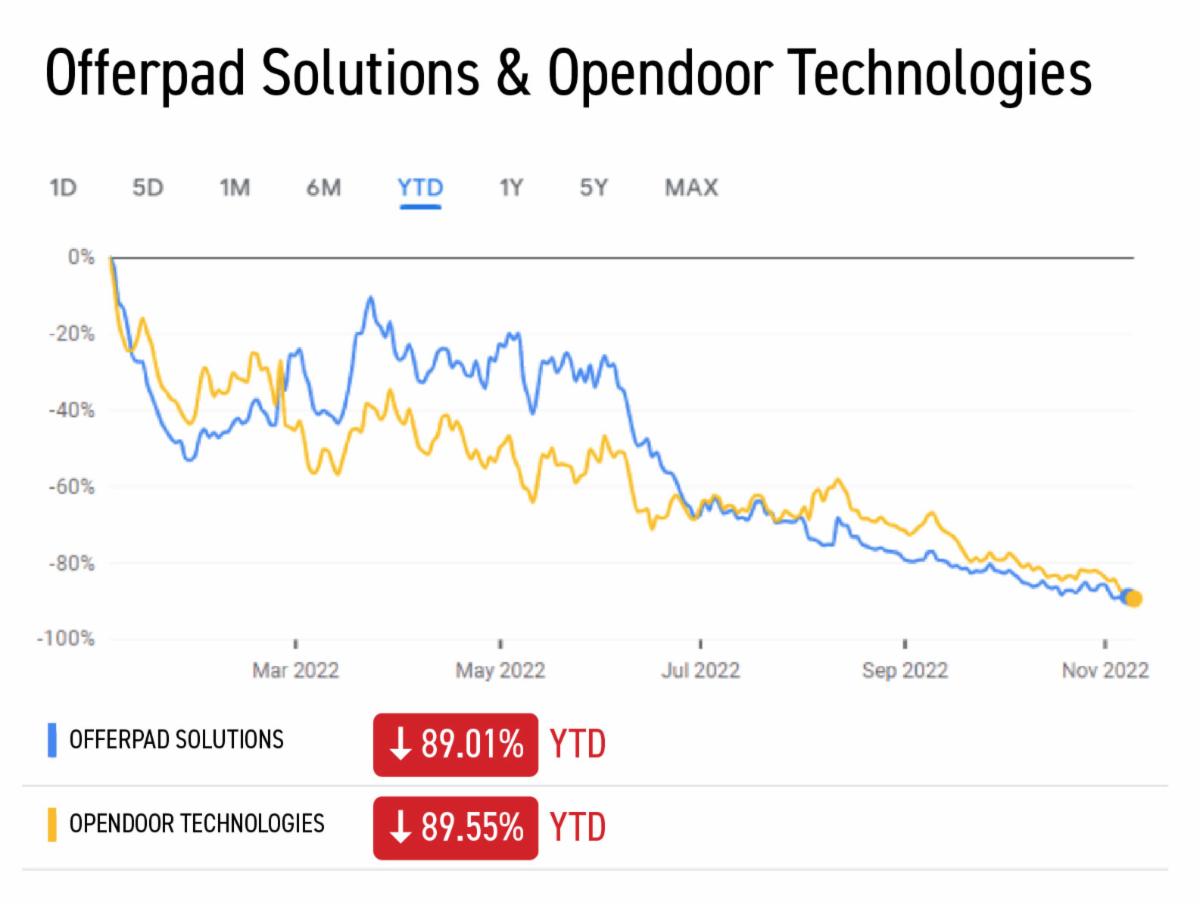
  • The crypto dumpster fire

Insider Conclusions

I know this flies in the face of almost everyone’s predictions that 2023 will be characterized by lower sales volumes and lower prices, but I think we’ll pull out of buyer market territory and be back in a seller’s market by fall.

The thing that kills transaction unit counts is uncertainty. And as it becomes clear that (1) crime is being brought to heel (2) interest rates have peaked (3) revitalization is happening in NYC and (4) NYC is a stable asset, confidence will drive asset purchases. With few new developments coming online there is no supply-side overhang to worry about. 2023 will be a solid year for real estate, with rising prices and healthy transaction volumes.

Have a great weekend, everyone!

SUBSCRIBE TO THE INSIDER


ARTICLES

This Trend Is Going to Reshape New York City – Let’s Talk About Commercial to Residential Conversions

By | The Insider | No Comments

WATCH NOW

SUBSCRIBE TO THE INSIDER


True,  Morgan Stanley and Goldman have successfully gotten people back to the office M-F.

—NY Post


They seem to be in the minority, however. Kastle Systems, which tracks security swipes at big office buildings, shows New York City has  not even recovered to 50% of pre-pandemic office occupancy (forget that 11/23 data point in the graph below; that was Thanksgiving week).

CHARTS: KASTLE


It has been my premise since mid 2020 that work from home (WFH) was going to be a relative flash in the pan, and I’ve been wrong. The trend is slowly normalizing but only oh-so-slowly.

Even if I am eventually right, and WFH is not a permanent thing but it takes a few more years to revert to the historical norm, that will not be fast enough for owners of office buildings in New York CIty. Office buildings are financed with debt. Debt is paid with rent. When office buildings stand vacant, things go pear-shaped for the owners rather quickly.

UC Berkeley published a study recently showing cell phone data usage in New York City is only 78% of pre-pandemic levels which is obviously not great.

CHART: BUSINESS INSIDER


More tellingly, the MTA’s usage data shows that the subways are barely back to 60% of pre-pandemic ridership levels.

All of this non-commuting, non walking around midtown and avoidance of offices is having an effect on office landlords.


Have a look at YTD stock prices for 4 NYC office REITs (investment companies that invest in NYC office buildings). Not pretty.

CHART: BLOOMBERG

No wonder Bloomberg reported on Monday that Silverstein Properties is raising $1.5 billion to purchase distressed office buildings and convert them to residential properties.

—Bloomberg


The Financial District is a fascinating study in urban renewal and is a model for how Midtown could be dramatically revitalized.  In 2000, there were just under 40,000 residents living in 20,300 housing units in the FiDi (according to that year’s Census).  Today there are over 82,000 people living in 44,300 units.  That’s a pretty big jump.

In 2005, when I started in this business, the FiDi was kind of a non-neighborhood. There was one halfway decent grocery store, Les Halles, Fraunces Tavern and… that was sorta it. Now you have the Oculus, Brookfield Place, Stone Street, a bajillion great restaurants, 9/11 Memorial, iPix, and it feels like a real nabe.

I am not saying that Midtown is starting from such a desolate place. What I AM saying is that for the last 10 years, it has felt rather old-in-the-tooth commercial with second rate retail and kind of neither-here-nor-there after business hours. A revitalization would be welcome, in other words.

Of course this will take political will to accomplish because of the regulatory hurdles. To wit:

  • Tax subsidies such as 421-G (proposed but not enacted)
  • Zoning (many buildings are in manufacturing zoned districts, which means they cannot convert to residential as-of-right)

There are also structural issues:

  • Pricing: with interest rates up, inflation up, and no tax abatement, developers need to keep acquisition prices at or below $400/sf for projects to be economically viable. This will require capitulation by current landlords (this appears to happening, however).

Buildings with large floorplates do not lend themselves to appropriate fenestration for residential units.


The Insider Prescription

Costar has reported that California has allocated $400 million to convert commercial buildings to condos (yes, already signed into law by Newsom). This is part of a $2 billion appropriation to build more affordable housing.

—costar.com


New York’s governor  would do well to pay attention, especially given the roster of real estate A-listers that donated to her campaign, including:

  • Larry Silverstein -Silverstein Properties
  • Steve Roth –  Vornado Realty Trust
  • Gary Barnett – Extell Development
  •  Jerry Speyer – Tishman Speyer
  • Stephen Ross – Related Companies
  • Jeff Blau – Related Companies
  • Don Peebles – Developer
  • James Dolan – Madison Square Garden

This is urgently what should happen:

  • Implement a new 421A-like tax break specifically for commercial to residential conversions
  • Provide low cost loans for these projects
  • Waive onerous zoning requirements (such as parking) for these conversions

Yes, this would cost money. The alternative, however, is worse: the hollowing out of our business districts without the urban renewal that could eventually replace those commercial tax receipts with residential ones.

Have a great weekend, everyone!


ARTICLE LINKS

“Morgan Stanley finally lures bankers back to the office 5 days a week”—NY Post
“NYC’s Silverstein to Raise $1.5 Billion for Office-to-Housing Push”

—Bloomberg

“From Los Angeles to New York, Underused Office Buildings Become Apartments Amid Housing Shortage”

—costar.com

China’s Goal and New York City Real Estate

By | The Insider | No Comments

WATCH NOW


SUBSCRIBE TO THE INSIDER


In today’s Insider, we hope to help you gain some perspective on the slow-moving train wreck that is China’s pandemic response.

We’ll also answer why China has stuck to its disastrous zero-covid policy.

Here’s something that I haven’t seen anyone else say: given the efficacy of China’s vaccine’s, and the transmissibility of Omicron, China would have to vaccinate over 100% of its population to reach herd immunity. Yes, we realize that’s mathematically impossible! (For those of you interested, see the appendix at the bottom).

This means China is stuck with their zero-Covid policy unless and until they produce a vaccine that is as effective as Moderna’s or Pfizer’s, since they refuse to use non-Chinese vaccines (at least thus far). They have been playing for time and hoping their next generation vaccines would roll out before the damage caused by zero-Covid became intolerable. Well, that gambit appears to have failed.

Remember when New York City was anxiously counting our hospital beds and people were sleeping in stretchers in the hallways? Well, Manhattan has over 500 hospital beds per 100,000 people.

China has 6.46 hospital beds per 100,000 people.

You see where I’m going with this, right? Pressure is ratcheting up over there as the Chinese government has come to the conclusion that letting the disease run its course is too dangerous, and the populace is simmering with resentment over the lockdowns and the privations they cause.

Something is going to give. Who knows what form that’s going to take, but it’s not likely to just settle down and quietly be back to business as normal.

Why on earth am I writing about this in the Insider?

We live in an interconnected world, for better or worse. If there is a release-valve event in China, and that event has big shock waves, what’s likely to happen?

  1. There will be a capital flight to quality
  2. This means assets will be sold globally and converted to dollar assets
  3. Central banks will flood the markets with liquidity, quickly dropping interest rates across the yield curve by lowering the Fed Funds rate and quantitative easing (buying mortgages and bonds).
  4. A certain amount of that liquidity will be parked in real estate

New York City, the blue chip of all blue chip real estate markets will be an oversized beneficiary of that.


In Other News…

Knight Frank (a Douglas Elliman affiliate), published a great article about their global residential luxury market predictions. Here’s the link, but I will spare you the work of reading it. Here are the key points:

In spite of the obvious global headwinds, they expect 16 out of the 24 global cities they track to increase in price in 2023.

Knight Frank expects New York City residential real estate to increase in price by 2% next year.


94 percent of Mainland Chinese high net worth individuals (HNWIs) plan to buy overseas in the next year (see my analysis above as to why).

From their survey of HNWIs globally, New York City is the second most popular city to buy a home in the next 1-2 years, following London.

Conclusions:

Stay calm, people. New York is where the rich want to be, and investors of all sorts will be coming here with cash purchases should there be any significant shocks to the global financial system. Even in the absence of that, New York City should price appreciate in 2023 by about 2%. That’s not a big number, but it’s a lot better than losing 25% in the stock market!

Have a great weekend, everyone!

SUBSCRIBE TO THE INSIDER


Appendix:

R0 (pronounced “R-naught”) is a basic statistic from epidemiology that measures how many people will get infected from each sick person. An R0 of less than one means the disease will die out rather rapidly. An R0 of 2 means each sick person will get two others sick. Measles has an R0 of 18, which tells you why it is such a scary disease.
The Omicron variant apparently has a R0 of 8.2 (more than Delta).
The efficiency of the two vaccines (as published by the WHO) is as follows:
Sinopharm: 79%
Sinovac: 51%
Here’s the formula for percentage of the population which needs to be vaccinated to achieve herd immunity:
[(R0 – 1)/ R0] / % vaccine efficacy = Percent needed to vaccinate
Let’s take China’s best case scenario and assume everyone over there was immunized with their better vaccine (Sinopharm). The formula would result in this:
[(8-1)/8]/79% = 111% of the population needed to be vaccinated (obviously impossible)

Recession and Real Estate. Implications for YOU

By | The Insider | No Comments

WATCH NOW


SUBSCRIBE TO THE INSIDER

—thebalancemoney.com


In the last few weeks, I’ve heard a lot of people fretting about an impending recession, and using this as a rationale for not purchasing real estate.  Well, here’s a news flash: there is not a strong correlation between recessions and real estate prices, positive or negative. Yeah, you read that right.

Let’s take a look:

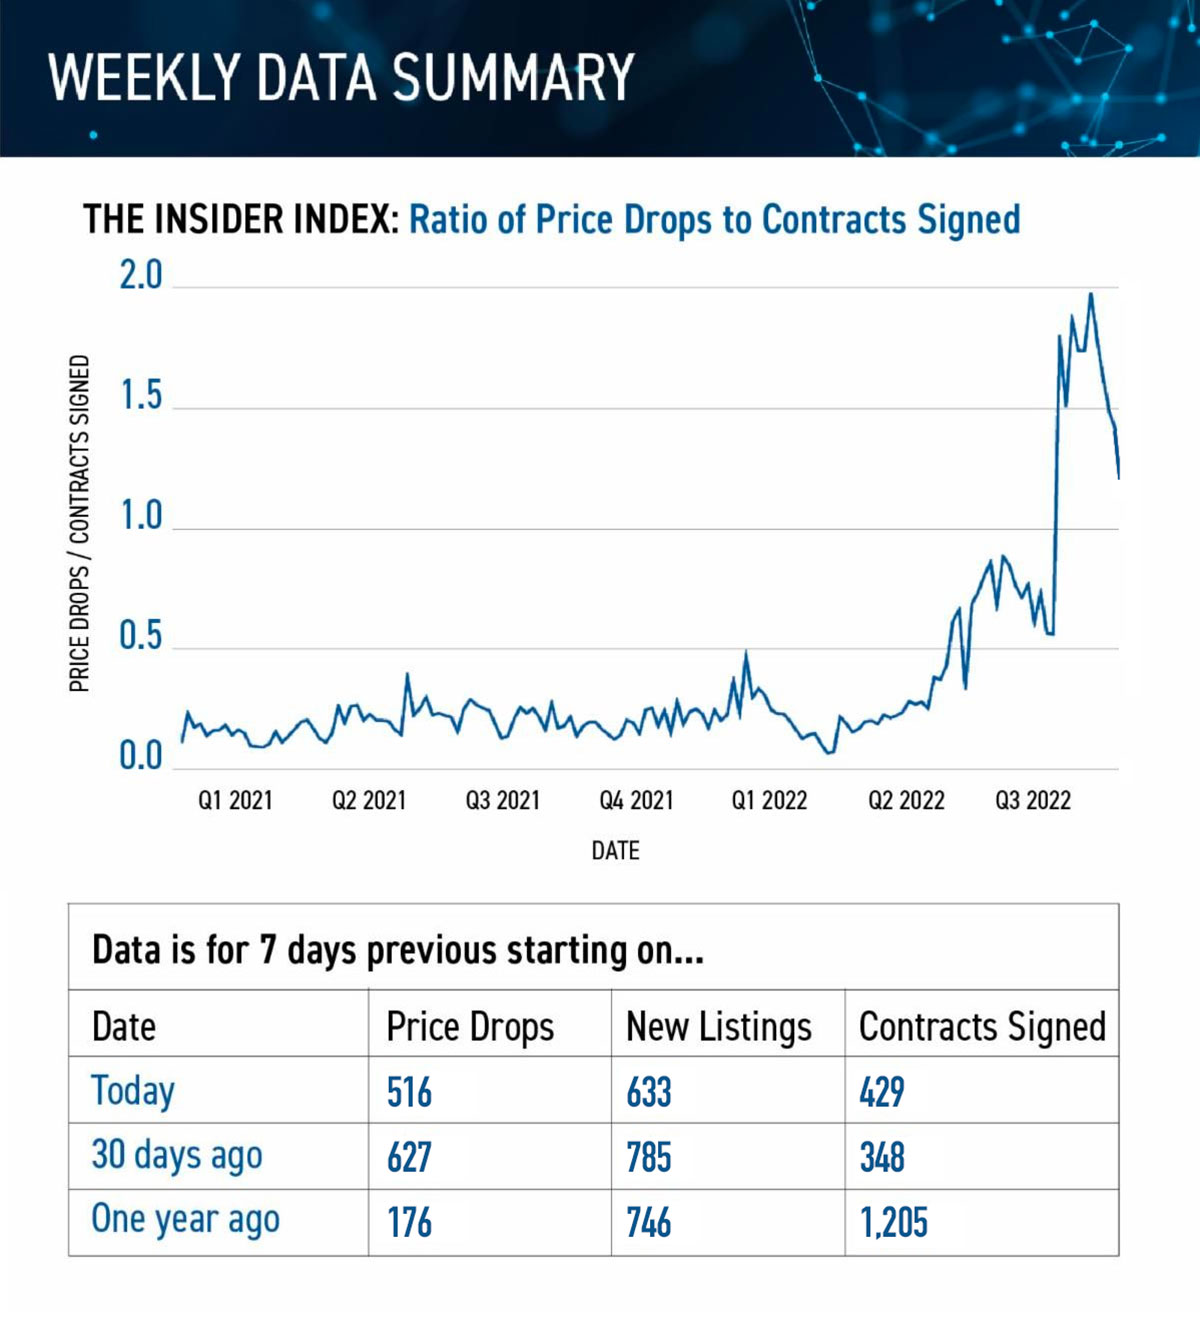
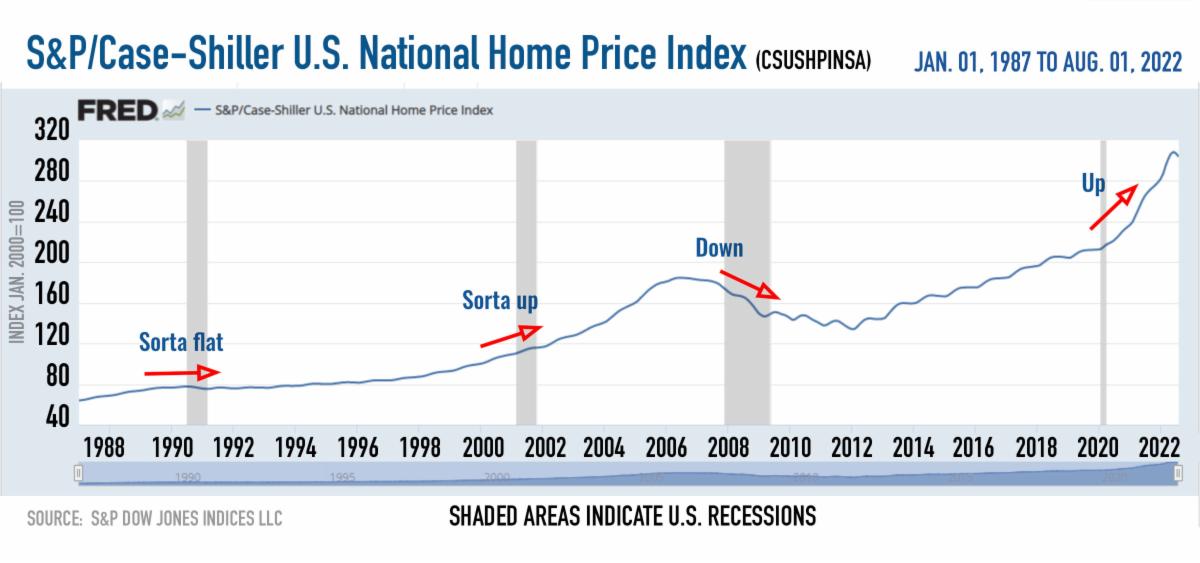
This graph shows the (national) S&P Case-Shiller US National Home Price Index from about 1987 to present. The gray areas are recessions. As you can see, home prices were flat, up or down during recessions during the last 45 years. Let’s be clear: I am NOT saying that prices won’t come down in real estate in NYC. What I AM saying is that making your decision predicated on the (seemingly consensus) idea that a recession is impending and that this means prices are coming down is not useful (and not based in actual reality).
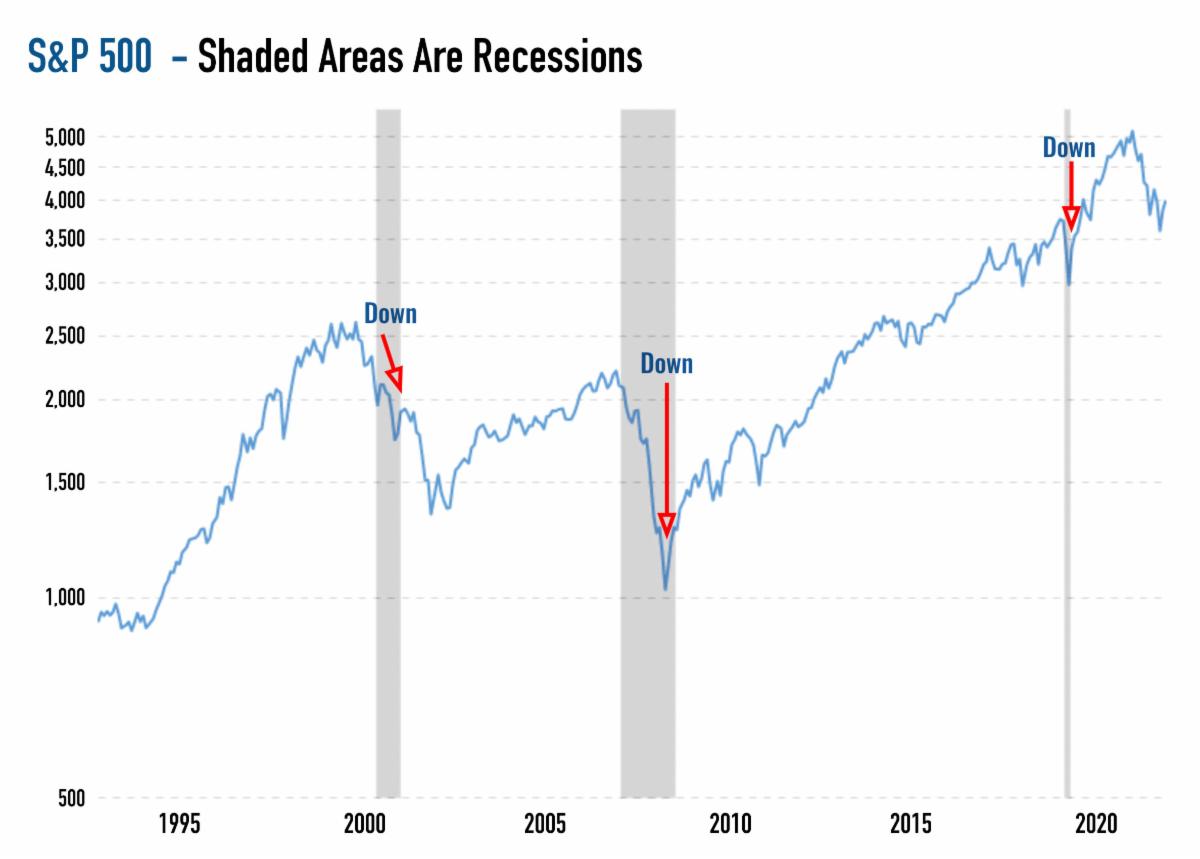
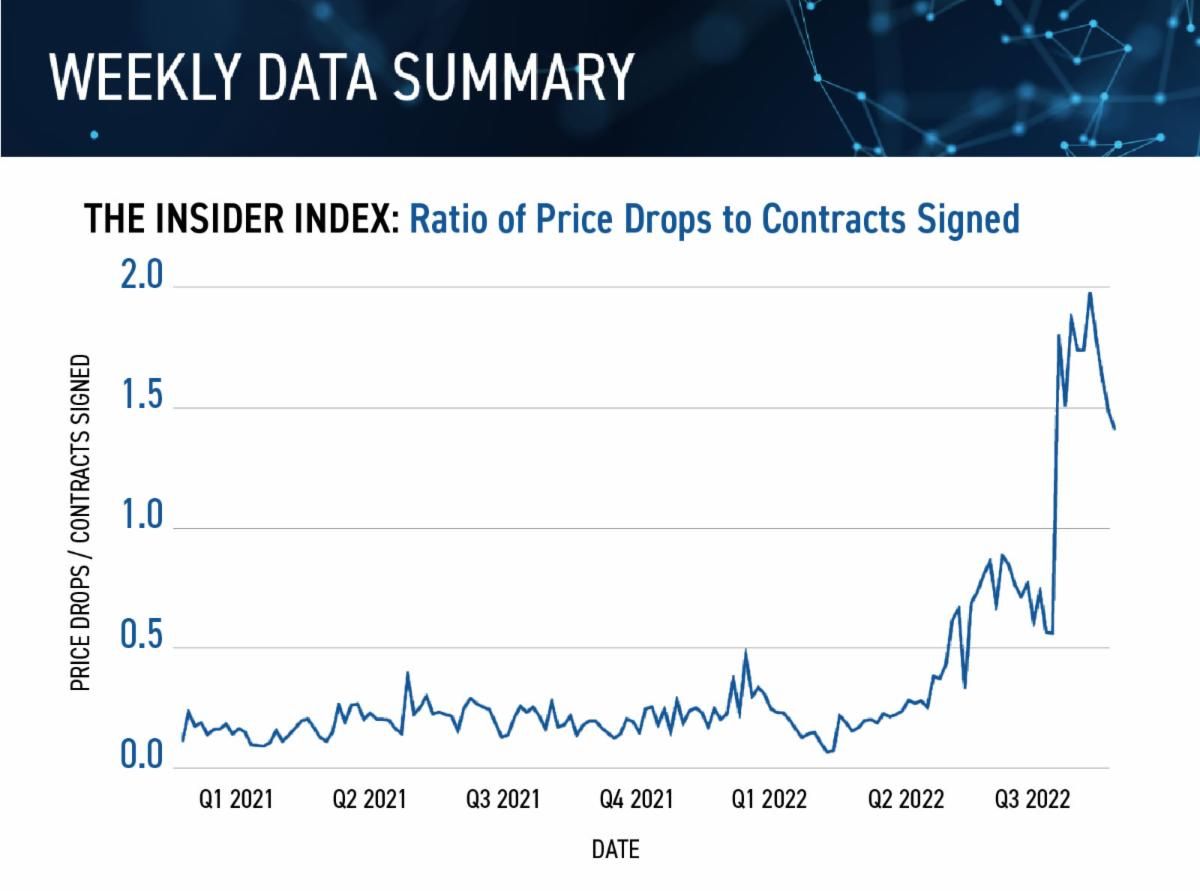
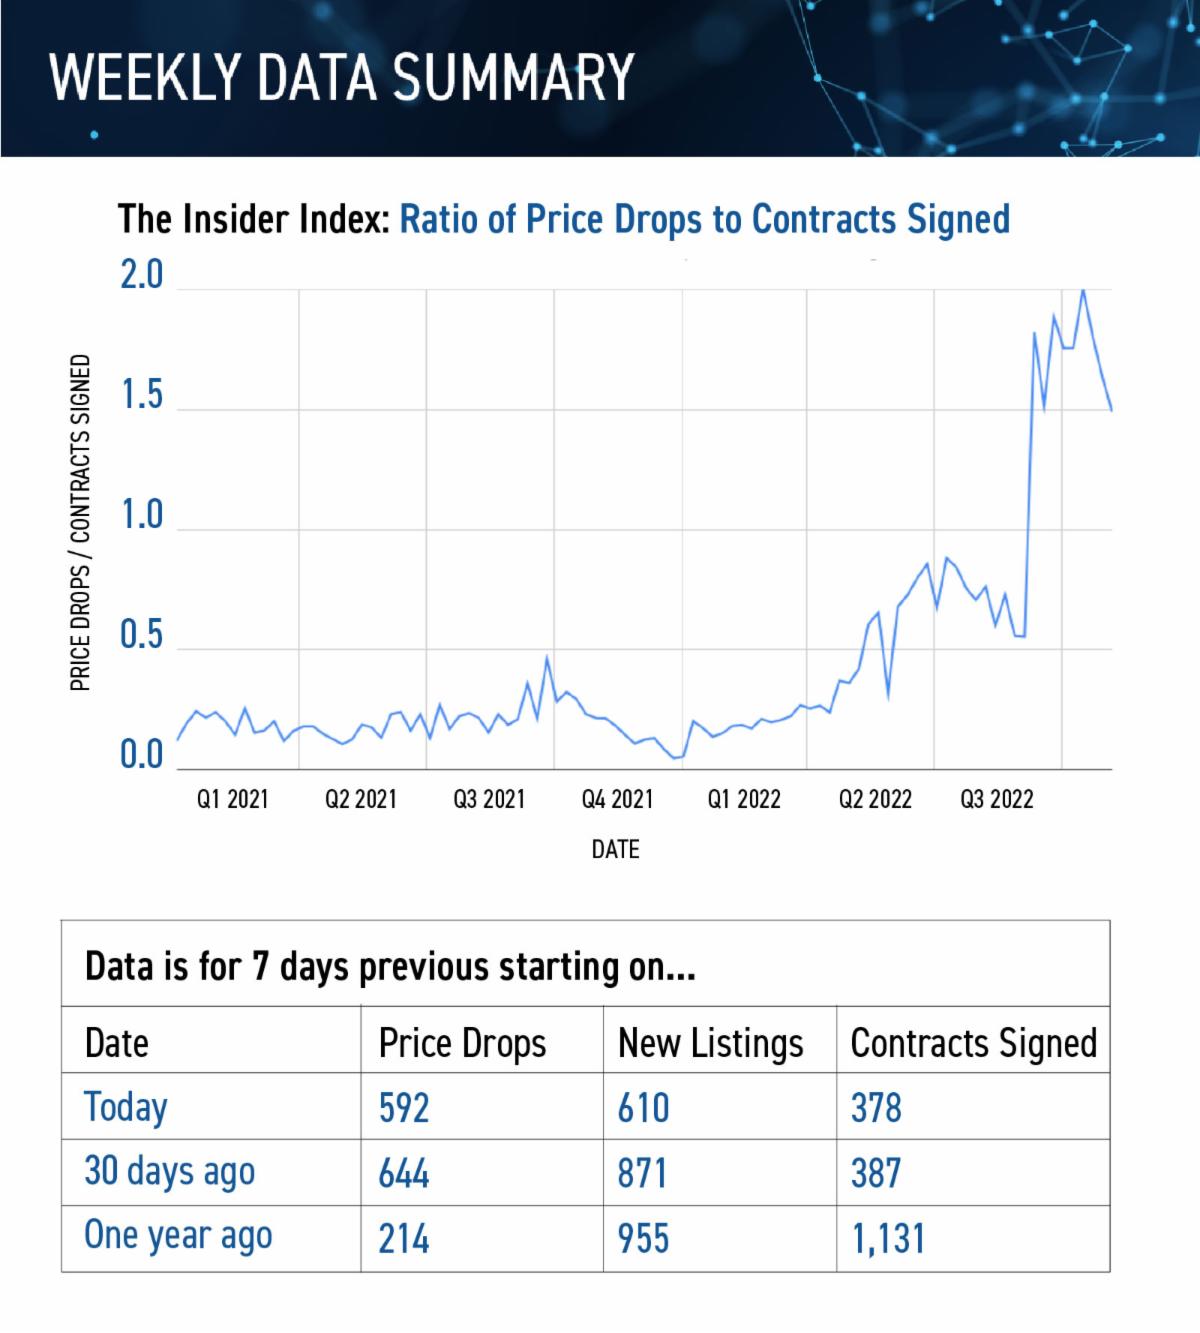
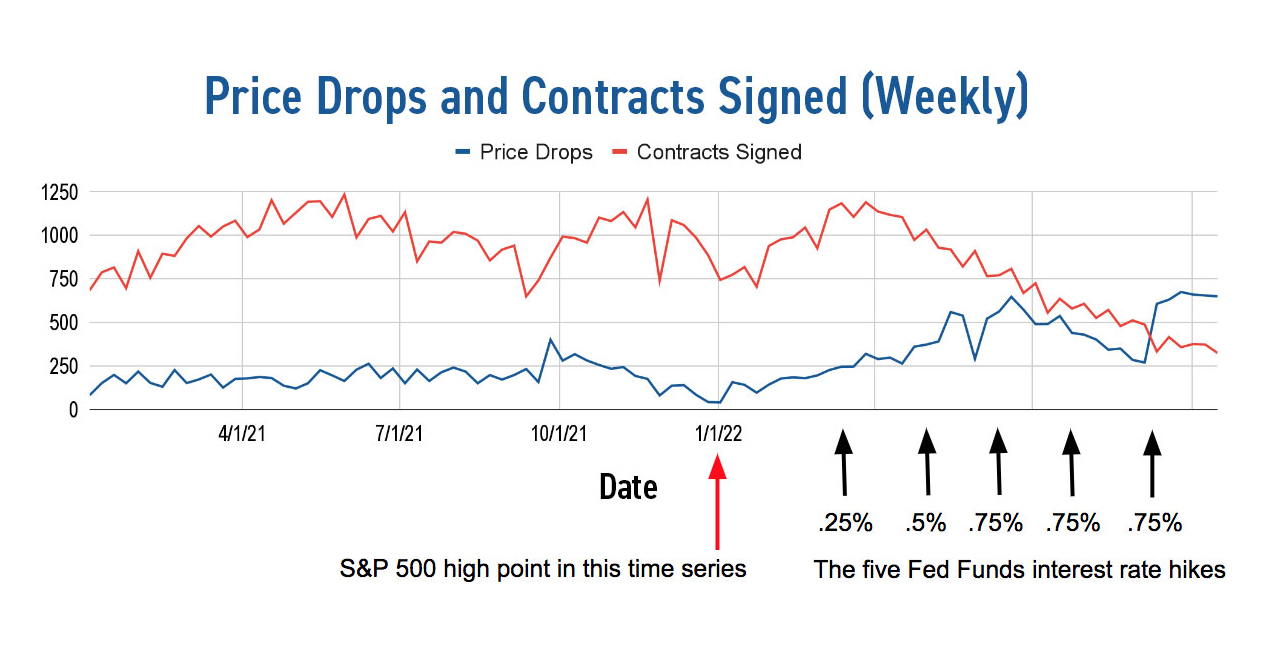

How about stocks? Well that’s a different story:

Here’s one conclusion: in the face of an (apparent) impending recession, it is probably better to be in real estate than in stocks.


Here’s another way to think about it. As we’ve written about in the Insider in the past, NYC real estate buyers are on average very different from the rest of the country. When your average home price is, say, $400,000, you save $40k, and get a loan for the rest.  In New York City because of our price points, jumbo loan requirements,  and the financial requirements of coops, a lot more cash is required. So people sell stocks and buy real estate. About half of them buy their properties for cash.  So for NYC property buyers, the purchase decision is more about asset allocation than affordability.

Let’s review asset classes:

Here’s what we know about real estate. Over the long term, it preserves its value. The Furman Center published the most comprehensive longitudinal study of real estate that I’m aware of, spanning 1974 to 2006. Their conclusion is just as relevant today as it was then:

  • Reassuringly, despite past price volatility, the overall health of the City’s real estate market remained strong over the past three decades, with the losses from the downturns representing only a fraction of gains from the upturns. Source: Trends in New York City Housing Price Appreciatio

—furmancenter.org


With all of this in mind, consider allocating more assets to real estate as it’s likely to outperform stocks in a recession.


Have a great Thanksgiving weekend, everyone!

SUBSCRIBE TO THE INSIDER

Look Out Below? NYC Still Best In Class

By | The Insider | No Comments

Watch the overview of today’s Insider with Josh Rubin and Mark Chin


The Insider Index continues to move back towards a more balanced market as you can see above.

This shows why the Index is moving nicely: contracts signed are ticking up while there are fewer price drops than a week ago.  You can see how sensitive this measure is to stock prices and mortgage rates, which have been both moving favorably in the last week.

SUBSCRIBE TO THE INSIDER


This week the Insider is focusing on price trends, and how to think about NYC in the context of what’s happening nationally. Realtor.com just published an article entitled ‘No One Wants To Catch a Falling Knife’: What To Expect in the Housing Market for the Rest of 2022”, and reading it, one would come to the conclusion that the sky is falling. Well maybe it is, but don’t expect it to be the same here as it is in other places.

—Realtor.com


Let’s look at some charts:

This chart plots median prices over time in Sacramento CA, a prototypical hot market in the pandemic.  You will notice that the January 2020 median price was about $420,000 and the peak was achieved in summer of 2022 at just about $625,000, a 49% increase over two and a half years.


Let’s look at Manhattan:

The January 2020 figure was $1.1 million, and the peak was achieved in May of 2022 of $1.26 million, an increase of 14.5%. The obvious conclusion: New York city has far less room to fall.


—GSpublishing.com


The paper is rather involved, so let quote the relevant points from Goldman’s own summary:

  1. Policymakers tend to stop hiking when year-over-year inflation is still relatively close to its peak, rather than waiting for it to fall significantly.
  2. Relatively large rate cuts tend to come fairly quickly after the hiking cycle ends.

Why do I think this is significant?  Because the headline of last week was that inflation had come down more than expected.

If sustained, this would imply we are very near the end of the tightening cycle. To quote from the Goldman Sachs report: “On average, hiking cycles ended when year-over-year inflation was within 10% of its peak (e.g. down from 5% to 4.5%).” As you can see we are within that range right now


So where does that leave us in terms of buying/selling strategy? The Insider has been harping on this point for months, but it boils down to: don’t be a sheeple. New York didn’t see the same massive price expansion that much of the country did during the pandemic. So don’t expect it to fall far, either, if the market softens. This means you should have the confidence to buy during this period of weakness knowing that real estate is inherently a long term investment. If you wait until the Fed is dropping rates, you will be in a very competitive market, with bidding wars making it difficult to get the home you want.


Have a great weekend, everyone!

SUBSCRIBE TO THE INSIDER

NYC Big Picture

By | The Insider | No Comments

Click to watch the recap of today’s Insider with Josh Rubin and Mark Chin

Let’s get this out in the open: yesterday (Thursday 10th November) the financial markets posted some remarkable results:

  • Dow up 1,200 points (+3.7%)
  • S&P 500 up 207 points (+5.5%)
  • Nasdaq up 760 points (+7.4%)
  • The yield on the 10 Treasury dropped 31.3 basis points (biggest one day drop since 2009)
  • 30 year jumbo fixed rate mortgages dropped from 6 ⅜ to 6.0%

Stocks are going to rock when the market perceives the Fed’s war on inflation is coming to an end, and yesterday’s action is a harbinger of things to come.

As I pointed out in the Insider last week, because of the frictional costs of buying and selling real estate, it’s appropriate to think about it in the medium to long term. In fact, most of the companies that were in the i-buyer space (that is, companies that offered to buy your home for cash immediately with the plan of sprucing them up and flipping them) are either licking their (rather deep) wounds or are out of the space entirely.

Licking wounds:

  • Opendoor (no choice but to tough it out; it’s their entire business model)

—TheRealDeal

  • Offerpad (no choice but to tough it out; it’s their entire business model)

—Inman

Source: NY Times


Out of i-buying entirely:

  • Keller Williams
  • Redfin
  • Zillow

Here’s the takeaway: short term trading real estate sorta works when the market is rocketing upwards. When the market is going down while financing costs are going up it is a guaranteed way to lose a shocking amount of capital quickly. So stop thinking about real estate in the short term already.

Let’s consider some of the larger demographic, structural, and financial forces at work.

  • NYC is not building enough apartments. It doesn’t take a genius to figure out that with rents breaking all-time highs this year, there is a scarcity of apartments in the city.
  • Construction finance has gotten a lot more expensive as interest rates have risen.
  • The 421-A tax incentive program expired in June of 2022. Over the last decade this program helped finance 117,000 apartments. Without this tax break, building rental buildings is not economic.
  • This is pushing developers to building condos, which have a slight edge over rentals without the 421-A tax break
  • However, in order to protect margins, developers have to build luxury properties, often building far fewer but larger units than they could as-of-right.

Note: most of the buildings that were torn down were walkups, most of what replaced them were 200+ foot towers with very large apartments.

Note: most of the buildings that were torn down were walkups, most of what replaced them were 200+ foot towers with very large apartments.

Housing is outstripping jobs rather spectacularly

(these data look at pre-Covid trends because post Covid data is super noisy). According to the Citizen’s Budget Commission, a research and advocacy group, “Between 2010 and 2018 New York City’s job base increased 22 percent, while its housing stock increased only 4 percent, resulting in the addition of only 0.19 housing units for every new job created this decade.”

The real estate industry in NYC is breathing a sigh of relief that Kathy Hochul was re-elected, having invested heavily in her campaign. There are two reasons for this: her commitment to the MTA and congestion pricing (which we covered here), and her plans to revive a 421-a tax abatement look alike.

evisited in 2023Earlier in 2022, Hochul proposed a new tax abatement called 485-w, which deepened the affordability requirements and percentage unit requirements to qualify. Opponents lambasted the measure as not doing enough and the proposal was ultimately pulled from the budget. Expect this concept to be revisited in 2023, as developers look for returns on their investment in Hochul’s re-election.

The old adage is “when the tide goes out, all the ships go down” and that is largely true. That being said, in New York City, the ebb tide is limited by a structural lack of supply that cannot be solved in the short term. Look for NYC to continue to outperform other large metro areas for the foreseeable future.

Have a great weekend, everyone!


SUBSCRIBE TO THE INSIDER

Bidding Wars Are Back! Yes, You Read That Right.

By | The Insider | No Comments

Click to watch the recap of today’s Insider with Josh Rubin and Mark Chin


In this “good news is bad news, bad news is bad news” kind of market, it is easy to get overwhelmed with doom scrolling. The Fed tightened another 75 basis points this week and the S&P immediately sold off. The GDP numbers are strong? The S&P sells off. The job market is stronger than expected? The S&P sells off.

So why is the City awash in bidding wars right now? Here at the Rubin Team, we carry significant inventory (usually 30-50 listings at any given time) and have a lot of buyers we’re working with. So we see a fairly good slice of the market, at least in Manhattan. And in the last week, the most notable thing we’ve seen is that 80% of Rubin Team agents have been involved with at least one competitive bidding situation in the last 7 days. Roughly 25% of the time when we’ve been representing buyers, we’ve seen best-and-finals. One of our listings just accepted an offer ~22% above the asking price.


Douglas Elliman internal data suggest that city-wide bidding wars account for 7% of current deals, as compared to a long-term average of 5% (Rubin Team data is heavily skewed to Manhattan south of 96th Street).


So what is going on?

  1. The sub 2 million dollar price point is dominated by white collar workers, and clearly these people are feeling confident (unless they work at Twitter). This suggests strength in NYC employment.
  2. Let’s not forget how much cash is always sitting on the sidelines here. By way of perspective, there are nearly 350,000 millionaires that live in New York City, and there are about 12,000-14,000 residential real estate transactions a year in Manhattan.
  3. As we wrote last week in the Insider, contracts signed per week have been decreasing since about March, and are now about 20% below their multi-year averages.
  4. In order for that to be true AND bidding wars to be happening, there can only be one conclusion: sellers have capitulated by dropping prices enough that buyers are finding selective value, even with interest rates up and the S&P 500 down.

Imagine what the market would look like if the S&P were a thousand points higher and interest rates were dropping.

Let’s talk about Inflation for a sec:

The traditional viewpoint is that real estate is a hedge for inflation. The theory is that “inflation” is the increase in price of goods and services. Real estate is the mother of all goods, so it should inflate as well.

Avison Young just published a study of this in the US, Canada, and the UK covering all real estate asset classes. I will spare you the details of all the correlation percentages and the lengthy analysis. Here’s the punchline: only residential real estate provides real (i.e. inflation adjusted) positive returns over every time horizon from 5 to 10 years, though the results in shorter time periods is more murky.


Conclusion:

This brings me to close on an ongoing theme of the Insider. I think that because New York is first and foremost the center of finance for the world (post-Brexit), people think about real estate in the same breath as stocks and bond funds and derivatives and such. But real estate is fundamentally not such a liquid asset and is a long term investment.


To highlight this point, imagine if you had a 10% frictional cost in buying and selling Tesla (or any) stock, as you do in real estate. You would surely be inclined to think about it as a long term investment rather than day trading it.


Therefore, the obsession with timing the real estate market is inappropriate and often leads to the wrong decision, when seen in the rearview mirror.

I remember taking clients out who were looking to invest in 2009 and 2010, who were obsessed with getting top condo product for under $1,000/sf. They couldn’t understand why the only thing I was showing them was seriously compromised in some way… like ground floor, or every window looking at a wall, or whatever. They ended up deciding to “wait for the bottom” of the market, and of course ended up missing out on a nearly decade run in prices.

Real estate returns need to be thought of in half-decade increments, not 6 month increments.

Have a great weekend, everyone!

SUBSCRIBE TO THE INSIDER

Risk and Reward in Real Estate: NYC Still the Pick of the Litter

By | The Insider | No Comments

Last week in the Insider we discussed the Insider Index, which showed buyer and seller sentiment in the market by looking at a ratio of price drops to contracts signed. 

This week, the Insider is pulling back the lens to look at things from a more macro perspective, as we like to do.


SUBSCRIBE TO THE INSIDER

Watch the recap of today’s Insider with

Josh Rubin and Mark Chin:

WATCH NOW


Last year, Bloomberg published an article entitled This One Metric Shows That New York City Will Be Fine (sadly behind a paywall) makes the point that New York City real estate may not appreciate as much as some other frothier markets (hello Austin and San Francisco amongst others). But New York does not go down as much when the market starts misbehaving. This means New York gives you the best return of any US city when adjusted for risk.


Yes, that was last year’s news. The point, however, is still relevant today. Let’s look at the UBS Global Real Estate Bubble Index, published last week.  In it, the bank ranks various global cities by bubble risk.  You will notice how low on the list New York City is.


Clearly this is good news. The report goes on to point out that New York has experienced a strong nominal price growth of almost 10% (y.o.y, halfway through 2022), but when measured in real terms (adjusted for inflation) we are flat for those twelve months. LA, San Francisco, and Boston all look worse through this lens.

Yes, there are headwinds for NYC, particularly with layoffs on Wall Street and in big tech, not to mention the recession that is about to start (or that we are already in, according to some).  With the S&P down, and interest rates up, the number of contracts signed in Manhattan is down.


That being said, there are some bright spots on the horizon. The overhang of new development product (on the market and shadow inventory) has evaporated. With the 421-A developer tax credit program now expired and construction financing getting very expensive as interest rates rise, it’s hard to see where new housing supply is going to be coming from, which will constrain the supply side of the equation.

Further, it’s been instructive to look at the stock prices of real estate sales companies in the last week.


So why is Anywhere Real Estate (formerly named Realogy) up 7.5%, Redfin up 15.97% and Re/Max up 5.82% in five days? Simple. The market is starting to think we are near the end of the current Federal Reserve tightening cycle. With the prospect of interest rates dropping in 2023, stock prices (which are leading indicators) are suggesting that the market thinks good times are around the corner.  Remember: dropping interest rates means a rising S&P 500. As I’ve written in the Insider before, when the S&P is up, NYC real estate follows.

It follows that if you want to establish a position in real estate, now would be a good time to start. Waiting until the lemming rush means you’ll be back in bidding war territory – and that could be soon.

Have a great weekend, everyone!


SUBSCRIBE TO THE INSIDER

The Inaugural Look at the Insider Index

By | The Insider | No Comments

With prevailing market sentiment somewhat uncertain, we have been considering how to articulate this this in data for our faithful Insider readers.  In today’s edition, we are introducing the Insider Index – a time series ratio of weekly price improvements and contracts signed in Manhattan.

SUBSCRIBE TO THE INSIDER

Watch the recap of today’s Insider with

Josh Rubin and Mark Chin:

WATCH NOW

Why is this useful?

As we all know, markets consist of supply and demand. Price adjustments are a direct correlation to seller sentiment. It is a sharper and more sensitive measure than supply itself. If seller’s expectations are becoming more realistic, rather than remaining obstinate by holding the line on their asking prices,  then it is clear that there is greater concern in the supply side of the market and that aspirational pricing is dissipating.

Contracts signed are our most accurate measure of demand. As we have mentioned in The Insider before, there is no direct measure of how much money is on the sidelines waiting to buy properties in the residential market, and there is no count of how many people are out looking at properties.  The only thing we have is the outcome of that demand, which is signed contracts.

So these two data series are very useful measures. The innovation in the Insider Index is in presenting these data as a ratio, which becomes useful.  

There is no direct place to get a time series on price drops. UrbanDigs doesn’t provide it in their Chart Room, Streeteasy doesn’t provide it in their Data Dashboard, and neither does Resource, the proprietary database used by the top three New York City brokerages, including Douglas Elliman. Even our favorite Manhattan expert, Jonathan Miller, doesn’t produce a chart on this. The good news is that we’ve done the hard work for you!

Let’s take a look and as always, we love hearing from you with your feedback!

These are data going back to Jan 1 2021.You will see a robust number of contracts being signed compared to the price drops in that period, and persisting until around the beginning of 2022, when price drops start rising rather dramatically.

From April 2022 to now, the number of weekly contracts signed drops consistently. Then, suddenly in September 2022 price drops are larger than contracts signed. Hello, buyer’s market!

Here is a more dramatic and clearer presentation of the same data, which is simply the ratio of price drops to contracts signed. This is the first time these data have been presented in this form that I’m aware of anywhere. 

In this format…

  • The cumulative effect of dropping stock market and interest rate hikes becomes clear; and
  • The magnitude of the market sentiment change is readily apparent.

One more chart for you follows, which explains how to interpret the Insider Index by the numbers:

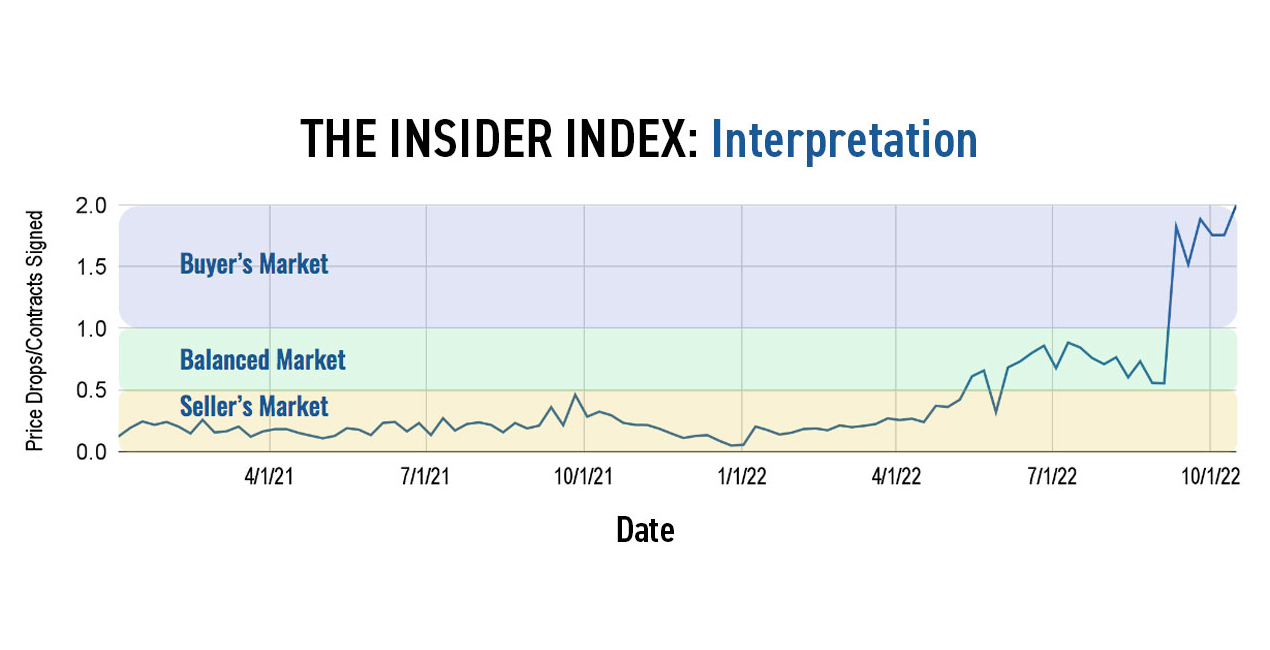
In a seller’s market, there are at least 4 signed contracts for every price drop.

A balanced market is anywhere from 4 signed contracts for every price drop to an even 1:1 ratio.

A buyer’s market is one in which there is at least one price drop for every signed contract. As you can see in the graphs above, currently there are two price drops for every signed contract. Now, that tells you something about this market.

We’ll continue to update our readers on how the Insider Index is behaving periodically.

In the meantime, have a great weekend, everyone!

SUBSCRIBE TO THE INSIDER

The Insider: Let’s Talk About Cars

By | The Insider | No Comments

As I have been writing about in the Insider, if there is a trigger that shakes the financial system it will be unlikely to originate in the housing market, unlike in 2008. In the last week, I have been considering whether the trigger could come from the auto financing sector. Why?


Watch the recap of today’s Insider with Mark Chin:

WATCH NOW


1. There is a price bubble in used cars – which seems to be collapsing

And it makes sense that the bubble would be collapsing. The cause was a supply chain meltdown, making new cars scarce and driving buyers into the used car market. But…


2. The Supply Chain Is Normalizing

The following graph shows the backlog of ships waiting to drop cargo in the Los Angeles Harbor.

Source: Marine Exchange of Southern California & Vessel Traffic Service Los Angeles/Long Beach


And here is a graph of an index of supply pressures maintained by the New York Federal Reserve:

With the supply chain normalizing, the new car market will spring to life and used cars will lose their luster. To add to that dumpster fire, buyer sentiment is swinging towards electric vehicles so older gasoline combustion engine vehicles are doubly under pressure.


Everyone knows that in 2008, the credit box for mortgages was loose. I’m pretty sure my dog could have gotten a (no-doc) loan but times have changed and mortgages are still relatively hard to get with bad credit. However, the same is not true of the auto loan market, where a large proportion of the 1.5 TRILLION of loans outstanding are sub-prime. And the loan amounts are going up, as you can see below.

You can see serious growth in subprime and “deep subprime” loans. Why are lenders making these loans? Because (1) the borrowers are paying 9%-20% (you read that right) and (2) the market is not nearly as regulated as the mortgage market. In a world that has been yield constrained for years, subprime loans have been a bright spot for yield hungry investors.

In other words, all the factors that led to the Great Recession are happening again, just in the auto loan market. Yes, this market is smaller ($1.5 trillion as compared to the ~$10 trillion mortgage market). Yes, LTVs are lower in car loans. Yes, the loan sizes are smaller. That being said, as the market slides into a recession, and with inflation persisting, subprime borrowers will be pushed to the brink. As they start to default on their loans the pain will be passed to the investors in this market. This could push a large financial institution into bankruptcy (here’s looking at you, Ally Financial). And that starts to sound very familiar.

Have a great weekend, everyone!

—Mark

SUBSCRIBE TO THE INSIDER