![]()

With prevailing market sentiment somewhat uncertain, we have been considering how to articulate this this in data for our faithful Insider readers. In today’s edition, we are introducing the Insider Index – a time series ratio of weekly price improvements and contracts signed in Manhattan.
SUBSCRIBE TO THE INSIDER
Watch the recap of today’s Insider with
Josh Rubin and Mark Chin:
 WATCH NOW
Why is this useful?
As we all know, markets consist of supply and demand. Price adjustments are a direct correlation to seller sentiment. It is a sharper and more sensitive measure than supply itself. If seller’s expectations are becoming more realistic, rather than remaining obstinate by holding the line on their asking prices, then it is clear that there is greater concern in the supply side of the market and that aspirational pricing is dissipating.
Contracts signed are our most accurate measure of demand. As we have mentioned in The Insider before, there is no direct measure of how much money is on the sidelines waiting to buy properties in the residential market, and there is no count of how many people are out looking at properties. The only thing we have is the outcome of that demand, which is signed contracts.
So these two data series are very useful measures. The innovation in the Insider Index is in presenting these data as a ratio, which becomes useful.
There is no direct place to get a time series on price drops. UrbanDigs doesn’t provide it in their Chart Room, Streeteasy doesn’t provide it in their Data Dashboard, and neither does Resource, the proprietary database used by the top three New York City brokerages, including Douglas Elliman. Even our favorite Manhattan expert, Jonathan Miller, doesn’t produce a chart on this. The good news is that we’ve done the hard work for you!
Let’s take a look and as always, we love hearing from you with your feedback!
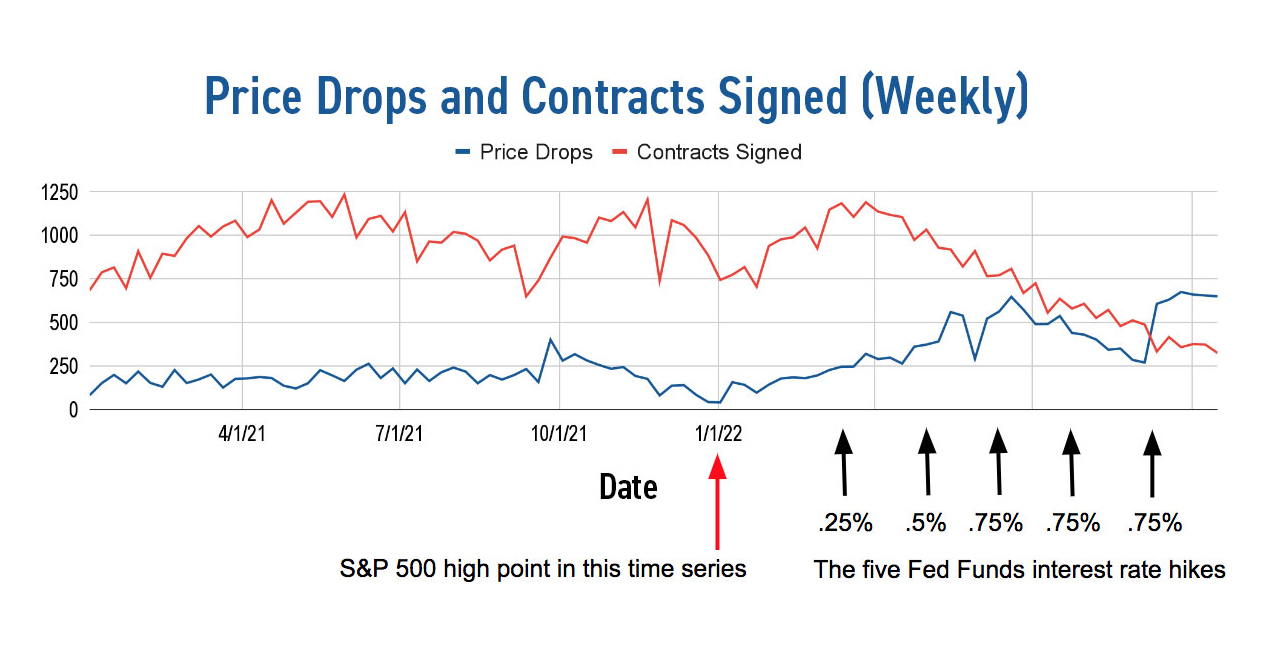
These are data going back to Jan 1 2021.You will see a robust number of contracts being signed compared to the price drops in that period, and persisting until around the beginning of 2022, when price drops start rising rather dramatically.
From April 2022 to now, the number of weekly contracts signed drops consistently. Then, suddenly in September 2022 price drops are larger than contracts signed. Hello, buyer’s market!
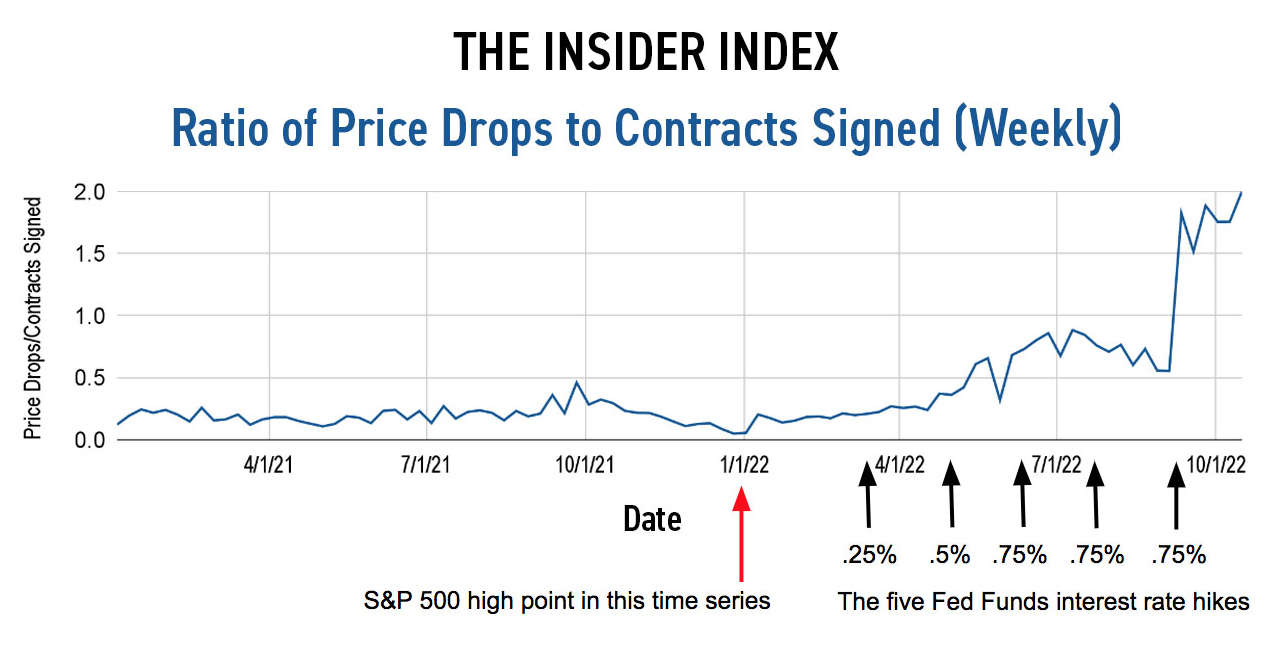
Here is a more dramatic and clearer presentation of the same data, which is simply the ratio of price drops to contracts signed. This is the first time these data have been presented in this form that I’m aware of anywhere.
 In this format…
- The cumulative effect of dropping stock market and interest rate hikes becomes clear; and
- The magnitude of the market sentiment change is readily apparent.
One more chart for you follows, which explains how to interpret the Insider Index by the numbers:
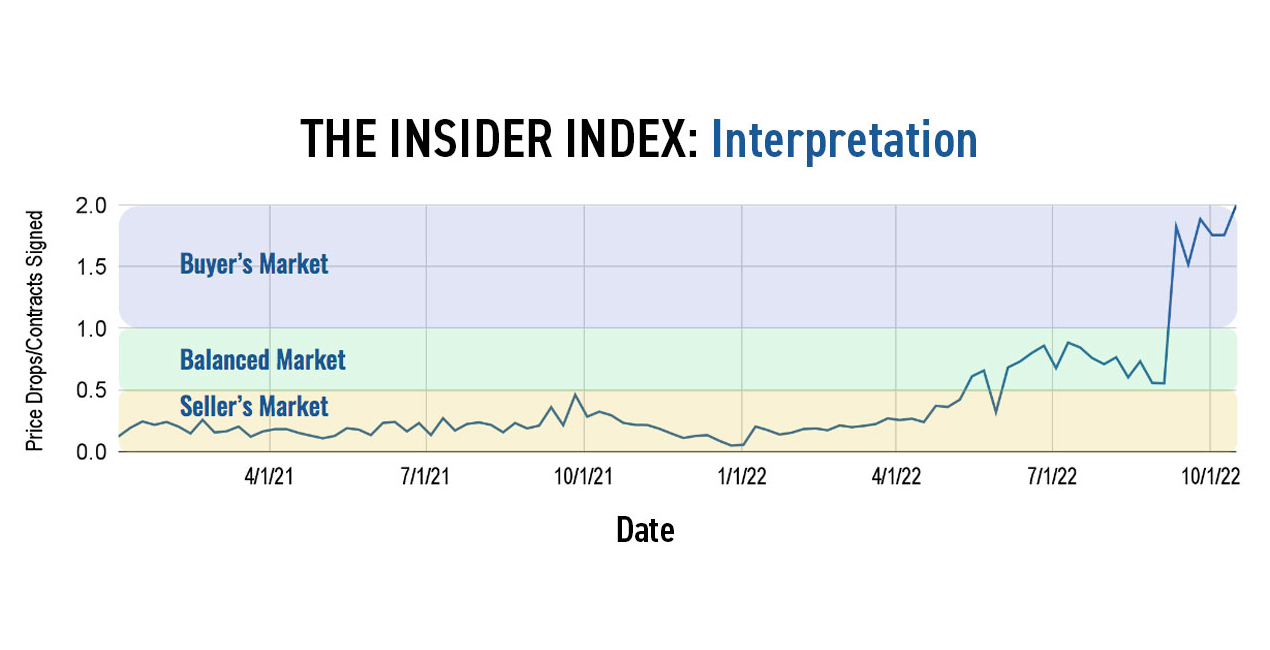 In a seller’s market, there are at least 4 signed contracts for every price drop.
A balanced market is anywhere from 4 signed contracts for every price drop to an even 1:1 ratio.
A buyer’s market is one in which there is at least one price drop for every signed contract. As you can see in the graphs above, currently there are two price drops for every signed contract. Now, that tells you something about this market.
We’ll continue to update our readers on how the Insider Index is behaving periodically.
In the meantime, have a great weekend, everyone!